1. FORWARD SCATTER METEOR OBSERVATIONS

Preliminary results.

Observer:       Eisse Pieter (Peter) Bus
Location:       Groningen, Netherlands  (6 deg 33' E, 53 deg 13' N)
Frequency:      72.11 MHz
Transmitter Location: Wroclaw, Poland, 130 kW, Distance 740 km
Antenna:        Yagi, 3 elements, geographical azimuth 106 deg (ESE),
                elevation 13 deg
Receiver:       Bearcat UBC 860XLT Scanning Radio, sensitivity: 0.5 uV
Observation method: Listening and counting in 5-minute intervals.

Mean "sporadic" activity on November 27, 1999.


Hour rates starting at UT:

17h00m   17h30m   18h00m   18h30m   19h00m    19h30   20h00m  20h30m
--------------------------------------------------------------------
  58       46       67       67       77        60      65      82

Mean activity (including dustparticles from comet P/Machholz 2?) on
November 28, 1999.

Mean "sporadic" activity on November 27, 1999.

Hour rates starting at UT:

17h00m   17h30m   18h00m   18h30m   19h00m    19h30   20h00m  20h30m
--------------------------------------------------------------------
  82       94       89       89      132        84      82      77

On November 29 follows a next observing session.

Peter Bus
Preliminary results
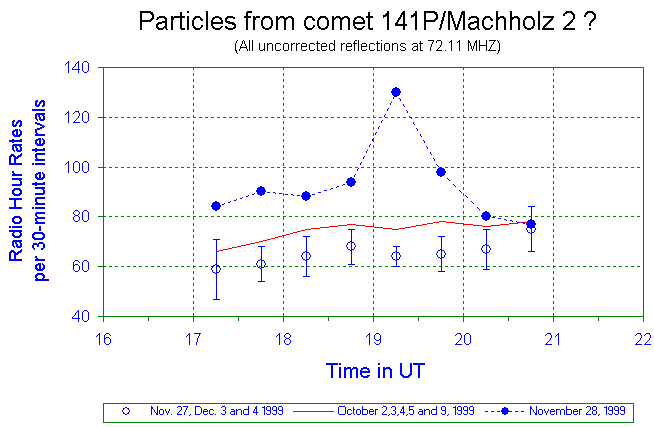
The figure below clearly shows the number of reflections between 17h - 21h UT
on November 28, 1999 rose significantly above background level as monitored on November
27 and December 3 and 4, 1999 and also above background level monitored in the first
half of October 1999.
It seems evident this enhanced activity is possibly caused by particles emerging from
comet 141P/Macchholz 2.
Maximum activity is monitored around solar longitude 246°.112 (in 1994 at 246°.146)*.
This conclusion is even more stressed through:
- Maximum activity is observed about 40 minutes before nodal passage (in 1994 about 45 minutes before nodalpassage).
- Activity around 20h45m UT is almost equal to the background level at the time of Radiant setting at 100km altitude above the midpoint of the transmitter-receiver path.
But is this conclusion valid?
- No visible observations are known at this moment and the origin of this enhanced activity as measured by means of forward meteor scatter is therefore still speculative.
A final report follows as soon as possible.
Peter Bus
* Node comet 246°.177 in 1994 and 246°.139 in 1999.
Literature:
- D.J.Asher and D.I.Steel, Mon. Not. R. Astron. Soc. 280, 1201-1209 (1996)
- Bus, E.P., Radiant 16, nr. 5, pp. 125 (1994)
- Bus, E.P., Radiant 16, nr. 6, pp. 143 (1994)
- IAUC 6053, 6066, 6070, 6071 and 6081 (1994)
- IAUC 7231 (1999)
- Jenniskens, P., privé correspondentie (1994)
- MPC 35815 (1999)

Figure 1. Uncorrected Radio Hour Rates per 30-minute intervals as recorded on November 28, 1999 (dots). The open circles represent the mean of the radio hour rates per 30-minute intervals as recorded on November 27 and December 3 and 4, 1999. The error bars represent 1-sigma errors. Also the mean radio hour rates are given as observed at the beginning of October (line).
| Back to DMS homepage |
This page was last modified on December 7, 1999 by Peter Bus and Casper ter Kuile |