Sino-Dutch Leonid Expedition 1998
Prospects on the Leonids 1998
E.P.Bus, Eerste Spoorstraat 16, NL-9718 PB Groningen
It appears there is a relation between the distance in the orbits of the Earth and comet 55P/Tempel-Tuttle
and the time of outbursts after the comet's perihelion passage when the Earth has crossed the comet's orbital plane.
An extrapolation departing from the 1833, 1866 and 1966 peak positions, the time of the outburst in 1998
was calculated for November 17 at about 21h38m UT.
However, because the latest orbital elements of comet 55P/Tempel-Tuttle (Epoch July 6.0 TT, 1998 and for
Epoch Jan. 22.0 TT, 1999) it appears that the calculated time of maximum is now about 25-minutes later at
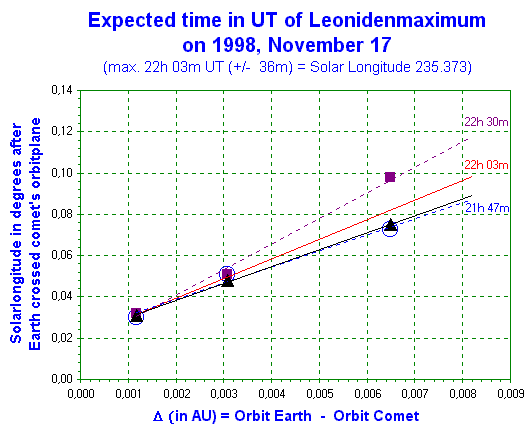
about 22h03m UT (± 36m), around solar longitude lo 235°.373 (± 0°.024).
In principle the window of opportunity stretches from about 21h25m until 22h40m UT.
A first peak close before the comet's node at 19h43m UT is still very likely.
However, because the extrapolations there is considerable room for deviations from the values given as a
'best estimate' above.

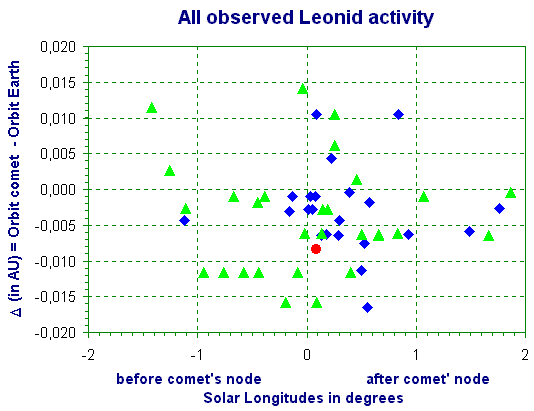
Figure 1. The activity of the Leonids as given in de literature [7,8,9] around two days before and after the Earth crosses the comet's orbitplane. Most of the given times are, according to the authors, estimations and is probably the course of the high scatter and the very low correlation. "Storms" are marked by diamonds and "showers" or "high activity" by triangles. The dot represents the expected position of 1998. The trend of higher activity after the comet's node than before is clearly noticeable in the figure. The data of 1097, 1399 and 1800 are missing because the day of maximum is very uncertain and the date of 1582 is missing because the given day is 11,5 days after the node. This day is probably wrong because of the Gregorian calendar reform in that year, 4 October 1582 is followed by 15 October 1582.

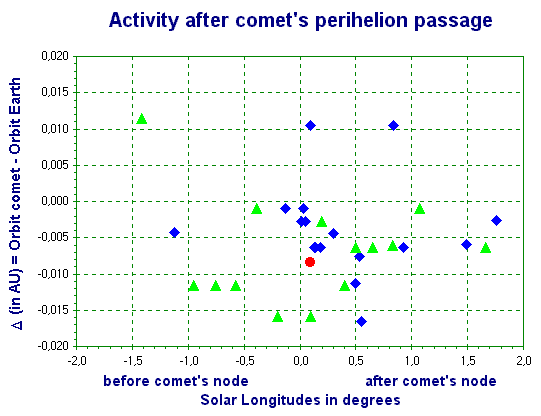
Figure 2. This diagram is equal to figure 1 except only data after the comet's perihelion passage is taken into account.

Figure 3. Correlation between the comet and the Earth orbital distance and the time of maximum activity of the Leonids after the comet's node within a year after perihelion passage of the comet. The red line represents the mean result between the different analyses: Squares represent the analysis of Kresák and open circles represent the analysis of Jenniskens and triangles the analysis in this paper.

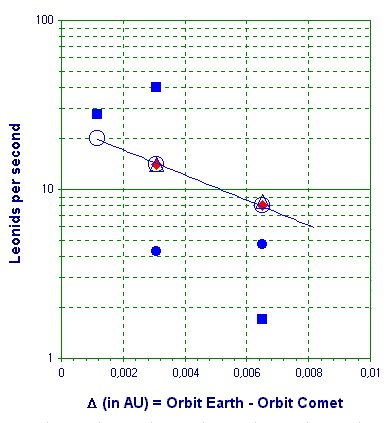
Figure 4. Relation between the number of Leonids per second at peak activity and the orbital distance between the Earth and the comet. The line represents the results of the model (open circles). The squares represent the analysis of Kresák, dots represent the analysis of Jenniskens, diamonds represent the analysis of Langbroek and triangles represent the analysis in this paper.
References
- Jenniskens, P., Meteoritics & Planetary Science, 31, 177-184 (1996)
- Jenniskens, P., in "1996-98 Leonid Outburst Event Summary", http://web99.arc.nasa.gov/~leonid/1998.html, (1998)
- Yeomans, D.K., K.K.Yau and P.R.Weisman, Icarus 124, 407-413 (1996)
- Langbroek, M., "Leonid outburst activity 1996", poster IMC (1998)
- Hasegawa, I., in "Meteoroids and their parent bodies", J. Stohl and I.P.Williams (eds.), 177-180, (1993)
- Curry, P.A., Mon. Not. R. Astron. 93, 3, 190-192 (1933)
- Yeomans, D.K., Icarus, 47, 492-499, (1981)
- Kresák, L., Astron.Astrophys. 279, 646-660 (1993)
- Mason, J.W., J. Br. Astron. Assoc. 105, 5 (1995)
- Jenniskens, P., Astron. Astrophys, 295, 206-235 (1995)
- Milon, D., J. Br. Astron. Assoc. 77, 2 (1967)
- Maanders, E.J., Hemel en Dampkring, 65, 6, 149-160 (1967)
- Heath, T., Atlas of Popular Astronomy, Plate X, (1922).
- Marco Langbroek, Privé communicatie, (juni 1998)