Preliminary results: enhancement of Ursid meteors
| the Netherlands | other Countries | Discussions | Links |
 Klaas Jobse : Video observations of 21/22 december at Oostkapelle Klaas Jobse : Video observations of 21/22 december at Oostkapelle |
| Marco Langbroek : Visual results of 21/22 december at Voorschoten |
| Carl Johannink : Visual results of 19-23 december at Gronau and Lattrop |
| Arnold Tukkers : Visual Results of 21/22 december at Lattrop |
| Romke Schievink : Picture of Ursid observers at VST/EPS-Lattrop |
| Koen Miskotte : Visual results of 20/21/22 december at Ermelo |
| ZHR Ursids : Combined results of LANMA, JOHCA, TUKAR, MISKO |
| Rob Sanders : Visual observations of 21/22 december at Eindhoven |
| Ton Schoenmaker : Meteor Scatter observations of 19-22 december at Roden |
| Juergen Rendtel : IMO Shower Circular - Ursids 2000 |
| Jean-Marie Biets : Visual Results of 21/22 december at Wilderen |
| Peter Jenniskens : Visual Results of 21/22 december at USA |
| Peter Jenniskens : Video Results of 21/22 december at USA |
| Sirko Molau : Video observations of 21/22 december at Aachen |
| Jiri Borovicka : Radar observations of 21/22 december at Ondrejov |
| Masaaki Takanashi : Visual observations of 21/22/23 december in Japan |
| Gary Kronk 1 |
| Tony Phillips |
| Gary Kronk 2 |
| Mike Linnolt |
| Sirko Molau |
| Richard Taibi |
| Hartwig Luethen |
| Daniel Fischer |
| Ursids 2000 : IMO Shower Circular |
| Ursids 2000 : NASA Science News |
| Ursids 2000 : predictions by Peter Jenniskens |
| Ursids 2000 : first results by Peter Jenniskens |
| Ursids 2000 : first results of visible spectroscopy by Peter Jenniskens |
| Ursids 2000 : first results by Marco Langbroek |
| Ursids 2000 : Gary Kronk |
| Current Meteor Activity Outlook : December 2000 (Robert Lunsford, AMS) |
| IAUC 7544 : Ursid 2000 predictions by Peter Jenniskens |
| IAUC 7548 : enhancement of Ursid 2000 meteors by Peter Jenniskens |
Klaas Jobse, Oostkapelle
According to statistics an interval of 30 minutes is used.
Please note the last point is well into twilight!
Astronomical twilight at Oostkapelle start at 05:46 UT
Marco Langbroek
Folks,
Nice Ursid rates over Europe last night. I observed from Voorschoten (the Netherlands) from 3:22 UTC untill twilight at 6:15 UTC with Lm at +6.3 and a mild frosty -2.5 C. Table with data below.
Ursids were well recognizable, but not out of the ordinary. Towards the end of the night, perhaps some indication of slightly rising rates. A quick very preliminary calculation with my data gives ZHR's in the order of ~10 while starting observations, and ZHR ~20 when ending observations. I plotted during the larger part of the night but switched to using tape recorder only at 5:15 UTC. Best meteor was a yellow -2 Ursid at 4:38:48 UTC.
- Marco Langbroek
Dutch Meteor Society (DMS)
Observer : Marco Langbroek - LANMA Location : Voorschoten, Netherlands, 52�07' N, 4�28' E Date : December 21-22, 2000 UTC Teff Lm Urs Spo --------------------------------- 3:22-3:45 0.35 6.3 2 4 3:45-4:15 0.47 6.3 4 3 4:15-4:45 0.43 6.3 5 7 4:45-5:15 0.43 6.3 8 4 5:15-5:45 0.50 6.2 9 8 5:45-6:15 0.50 6.1 8 6 TOTAL: 2.68 <6.3> 36 32 strm/mag -2 // +1 +2 +3 +4 +5-------------------------------------------------- Ursids 1 1 3 19 11 1 <3.08> Sporadics 0 0 9 12 11 0 <3.06>
---
Marco Langbroek          private: marco.langbroek@wanadoo.nl
Leiden University        work: m.langbroek@arch.leidenuniv.nl
Faculty of Archaeology   Ursids on Personal Website

P.O. Box 9515
NL-2300 RA Leiden
The Netherlands
Carl Johannink
Date : 19/20-12-2000
Observer: Johannink, Carl (IMO-code: JOHCA)
Place : Gronau (Germany)
Coord. : 7�01'E ; 52�13'N
Center : R.A.=11h00m; Decl.=70 deg. at 04:30 UT
Start : 04:10 UT
End : 05:16 UT
Teff : 1.10 hours
Time(UT) Urs Com Spo n LM Notes
-----------------------------------------
04:10-05:16 1 1 7 9 5.4 1.1 hours
<-2 -2 -1 0 1 2 3 4 5 6 m n
------------------------------------------
Urs 0 0 0 0 0 0 0 1 0 0 4.00 1
Com 0 0 0 0 0 1 0 0 0 0 2.00 1
Spo 0 0 0 0 0 1 2 3 1 0 3.57 7
============================================================
Date : 20/21-12-2000
Observer: Johannink, Carl (IMO-code: JOHCA)
Place : Gronau (Germany)
Coord. : 7�01'E ; 52�13'N
Center : R.A.=11h00m; Decl.=70 deg. at 04:30 UT
Start : 04:08 UT
End : 05:20 UT
Teff : 1.20 hours
Time(UT) Urs Com Spo n LM Notes
------------------------------------------
04:08-05:20 2 0 11 13 5.5 1.2 hours
<-2 -2 -1 0 1 2 3 4 5 6 m n
-------------------------------------------
Urs 0 0 0 0 0 1 0 1 0 0 3.00 2
Com 0
Spo 0 0 0 0 0 0 2 8 1 0 3.91 11
============================================================
Date : 21/22-12-2000
Observer: Johannink, Carl (IMO-code: JOHCA)
Place : Lattrop (Netherlands)
Coord. : 6�58'E ; 52�26'N
Center : R.A.=10h00m; Decl.=70 deg. at 04:30 UT
Start : 02:42 UT
End : 06:15 UT
Teff : 3.05 hours
Time(UT) Urs Com Spo n LM Notes
-----------------------------------------------
02:42-03:15 4 1 9 14 6.3 0.55 hours
03:15-03:45 4 1 7 12 6.3 0.50 hours
03:45-04:30 5 0 10 15 6.1 0.75 hours
04:56-05:30 8 0 9 17 6.1 0.50 hours (!)
05:30-06:15 10 0 6 16 5.9 0.75 hours ; LM 5.0 at end
<-2 -2 -1 0 1 2 3 4 5 6 m n
--------------------------------------------
Urs 0 0 0 0 0 6 7 9 8 1 3.71 31
Com 0 0 0 0 0 0 1 1 0 0 3.50 2
Spo 0 0 0 0 1 2 10 15 12 1 3.93 41
============================================================
Date : 22/23-12-2000
Observer: Johannink, Carl (IMO-code: JOHCA)
Place : Gronau (Germany)
Coord. : 7�01'E ; 52�13'N
Center : R.A.=11h00m; Decl.=70 deg. at 04:30 UT
Start : 03:55 UT
End : 05:32 UT
Teff : 1.62 hours
Time(UT) Urs Com Spo n LM Notes
----------------------------------------------
03:55-04:40 0 0 7 7 5.8 0.75 hours
04:40-05:32 0 1 8 9 5.8 0.87 hours
<-2 -2 -1 0 1 2 3 4 5 6 m n
-------------------------------------------
Urs 0
Com 0 0 0 0 0 0 1 0 0 0 3.00 1
Spo 0 0 0 1 0 1 2 8 3 0 3.67 15
============================================================
C.F. Johannink
Schiefestrasse 36
48599  Gronau
Germany
Phone: + 49 2562 22345
Email: cjohannink@netside.de
Koen Miskotte
20/21-12-2000

Period UT   Teff  LM   URS XOR LYN SPO Tot.
------------------------------------------
1:45-2:48   1.05  6.0   1   1   1   8   11
2:48-3:52   1.07  6.0   2   1   0  10   13


Magnitude    0   1    2    3    4    5
--------------------------------------
Ursids                1    1    1
Ksi-Orionids               1         1
Lyncids                         1
Sporadics             1    4   10    2

=======================================================

21/22-12-2000

Period UT   Teff  LM   URS XOR COM SPO TOT.
------------------------------------------
1:35-2:40   1.08  6.4   1   1   1  13   16
2:40-3:41   1.02  6.4   2   1   1  11   15


Magnitude    0   1    2    3    4    5
--------------------------------------
Ursids                1         1    1
Ksi-Orionids                    1    1
Coma B.                    2
Sporadics             2    8    9    5
Marco Langbroek (LANMA), Carl Johannink (JOHCA), Arnold Tukkers (TUKAR), Koen Miskotte (MISKO)
r-value = 3.0 ; Gamma = -1.4
Cp-LANMA = 1.4 ; Cp-JOHCA = 1.6 ; Cp-TUKAR = 3.0 ; Cp-MISKO = 1.2
Romke Schievink
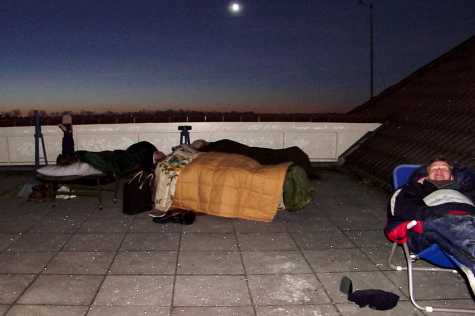
To the far left is Arnold Tukkers, at center in front is Carl Johannink, at center rear is Rita Verhoef and at far right is Sietze Dijkstra. The crescent moon is at center top of this picture taken by Romke Schievink at the end of the observing session on december 22, 2000 at 06h15m UT.
Rob Sanders
Date : 22-12-2000 Observer : Sanders, Rob Place : Eindhoven, The Netherlands Coord. : 5� 31' 44" E ; 51� 21' 58" N (ANWB paddestoel 20934) Center : R.A.=13h25m; Decl.= +55 deg. at 05:00 UT Start : 03:40 UT End : 06:10 UT Teff : 2.5 hours Time(UT) n LM Notes ---------------------------------------------- 03:40-04:10 1 5.4 no moon, temp=-6�C 04:10-04:40 4 5.5 04:40-05:10 7 5.8 moonrise 05:10-05:40 3 5.8 05:40-06:10 2 5.2 temp=-6�C grand total: 17 Magnitude -1 0 1 2 3 4 5 6 n ------------------------------------ Ursids 1 0 0 0 2 2 2 0 7 Sporadics 3 2 0 2 1 2 0 0 10 grand total : 7 + 10 = 17 Place : Eindhoven, The Netherlands Coord. : 5� 31' 44" E ; 51� 21' 58" N (ANWB paddestoel 20934) GSM-BEN : 06.24.84.90.77
Ton Schoenmaker
Observer:    Ton Schoenmaker
Location:    Roden, Netherlands (06 26' E, 53 08' N)
Frequency:   55.275 MHz
Transmitter: Spanish TV channel E3 (video); transmitters in La Muela (30 kW),
             Gamoniteiro (50 kW) and Aitana (60 kW); all stations within
             100 Hz of nominal frequency; distance ~1500 km
Antenna:     3-elements horizontal Cushcraft 50 MHz Yagi tuned to 55.3 MHz;
             geographical azimuth 210 degrees (SW)
Receiver:    Yupiteru MVT-9000 in USB mode; sensitivity 0.5 uV at 12 dB S/N
Observing:   800 Hz audio signal from earphone socket was rectified, digitised
             and fed into a PC via the parallel computer port. HP VEE was used
             to process the digitised signal and to store 15-minutes counts of
             reflections stronger than 0.22 uV (-120 dBm). Also for all
             individual meteors date, time, duration (dead time) and maximum
             signal are stored.
Figure 1 shows the uncorrected results of forward scatter observations of the Ursids. By comparing the activity on three successive days a small increase in activity was observed on 22 December 2000 around 9h UTC. The reflection percentages (dead time) showed no significant activity. Due to pointing of the antenne (about SW), observability for the Ursids was low from 2h - 6h UTC and best at 11h30m UTC.
Ton Schoenmaker, Dutch Meteor Society and IMO
Meester Homanstraat 8, NL 9301 HP Roden, Netherlands
E-mail: schoenmaker@NFRA.nl
Call: PA0EFA
Jean-Marie Biets
Date : 22/12/2000 Observer : BIETS JEAN-MARIE (BIEJE) Place : WILDEREN(BELGIUM) Coord. : 5�08'E ; 50�49'N Center : UMi Start : 4h45m UT End : 6h15m UT Teff. : 1h30m UT (recording) Time (UT) URS BOO SPO LM --------------------------------- 4h45m-5h00m 6 1 0 6.0 5h00m-5h15m 2 0 1 6.0 5h15m-5h30m 2 0 1 6.0 5h30m-5h45m 2 0 1 5.8 5h45m-6h00m 2 0 1 5.6 6h00m-6h15m 0 0 0 5.2 magnitudes: <-2 -1 0 1 2 3 4 5 m: n ---------------------------------------------------- URS: 1 1 0 2 4 2 2 2
Arnold Tukkers
Date : 20/21-12-20000
Observer: Arnold Tukkers (ATL)
Place : Lattrop, Netherlands
Coord. : 6�58'E - 52�26'N
Start : 02:45 UT
End : 06:15 UT
Teff : 3.00 hours
Time(UT) Urs Com Spo n LM
----------------------------------------
02.45 - 03.15 5 1 4 10 5.7
03.15 - 03.45 4 1 11 16 5.7
03.45 - 04.15 1 4 5 5.7
04.15 - 04.45 3 1 4 5.7
04.45 - 05.15 6 3 9 5.7
05.15 - 05.45 10 8 18 5.6
05.45 - 06.15 8 1 3 12 5.0
2 3 4 5 6 N N~ (M)
----------------------------------------
Urs 5 9 16 6 - 36 1 3.6
Com 4 1 - 4 - 4.2
Spo 2 13 15 5 - 34 - 3.7
Peter Jenniskens
Early Ursid results
=============
The Ursid shower did flare up significantly last night between 5 UT and 9:30 UT, with a peak around 7:20�10 UT, close to the predicted maximum at 7:29 UT. Attached are foreward scatter observations by Esko Lyytinen, showing the increase of rates much as predicted in our paper (P. Jenniskens & E. Lyytinen, "Possible Ursid outburst on Dec. 22, 2000", WGN, the Journal of the IMO (2000)).
US observers were best located for the event, although European observer Marco Langbroek of the Netherlands reports observing the onset of the shower at 5-6:15 UT, at which time the ZHR was about 20.
The shower was observed by us from California, using video imaging and spectroscopy techniques. Present were Peter Jenniskens, Ming Li and Duncan McNeill at a site near Parkfield, and Pete Gural, Mike Koop, Mike Wilson, and Chris Angelos at the San Antonio Lake campground near King City. Local weather allowed observations between about 5:40 and 11:00 UT. Results await data analysis, however several relatively bright Ursids were seen (magnitude +1 to -1), some of which may have been recorded by the low-resolution spectrograph. A zero magnitude Ursid left a half-second duration wake. Six intensified cameras at each site recorded the variation of flux and Ursid light curves. Some very minimal visual observations between operations of equipment are reported below and suggest a ZHR of about 50 half an hour after the peak, comparable to the Perseid shower in summer.
Obs : Peter Jenniskens Loc.: Parkfield, California (about 120.0 Deg. W, +35.9 deg. N) Date: December 21-22, 2000 UTC Teff Lm Urs Spo ZHR(Urs) ----------------------------------------- 08:07-08:19 0.20 6.2 4 3 50�25 08:31-08:52 0.35 6.2 4 2 27�14 09:13-09:32 0.32 6.2 2 3 14�10 10:14-10:55 0.69 6.2 6 12 17�7 ============================================================ Obs : Peter Gural Loc.: King City, California (about 121.0 Deg. W, +35.8 deg. N) Date: December 21-22, 2000 UTC Teff Lm Urs Spo ZHR(Urs) ------------------------------------------ 08:01-08:10 0.15 6.2 10 2 200�65
We plan to present an update at the Leonid MAC website after a good day's sleep and more information has been received
(http://leonid.arc.nasa.gov).
Peter Jenniskens
SETI Institute
NASA Ames Research Center
pjenniskens@mail.arc.nasa.gov
Peter Jenniskens
We've analysed the first video tape of our observations in California and find the following (preliminary) rate of Ursids.
Camera: XX1332 Mullard Gen II intensifier, f1.8 50mm optics. Recorded on Hi-8. The field of view of this camera is 47 x 35 degrees, aimed at an elevation of 56 degrees West-North-West. Operated by Peter Jenniskens from 120.0W,+35.9N.
time (UT)  N urs  N other
5:30-5:40    1    0
5:40-5:50    1    0
5:50-6:00    1    2
6:00-6:10    2    2
6:10-6:20    1    5
6:20-6:30    0    2
6:30-6:40    1    1
6:40-6:50    1    3
6:50-7:00    3    0
7:00-7:10    3    4
7:10-7:20    2    0
7:20-7:30    3    0
7:30-7:40    2    2
7:40-7:50    7    0
7:50-8:00    1    3
8:00-8:10    3    3
8:10-8:20    3    0
8:20-8:30    6    3
8:30-8:40    1    1
8:40-8:50    4    0
8:50-9:00    1    1
9:00-9:10    4    5
9:10-9:20    0    0
9:20-9:30    0    4
9:30-9:40    1    1
9:40-9:50    1    5
9:50-10:00   2    4
10:00-10:10  0    5
10:10-10:20  0    1
10:20-10:30  0    2
10:30-10:40  1    3
10:40-10:50  0    2
10:50-11:00  1    1
11:00-11:10  1    2
11:10-11:20  0    2
These were gathered by Peter Gural from a visual scan of the tapes of one of our intensified video camera's at Parkfield. 11 more cameras to go. We also detected at least one Ursid spectrum at 08:24:57 UT, covering the wavelength range from about 400 to 850 nm, the meteor of which was imaged from both observing sites. 19 double station Ursids thus far after comparisson with part of the tapes from an aligned intensified video camera at San Antonio Lake.
An update of further observations is maintained at:
http://www-space.arc.nasa.gov/~leonid/leonidnews29.html
Sirko Molau
Folks,
here are first results from visual (MOLSI, lm 5.9...6.0 mag, F=1.1) and video (AVIS, lm ~6.0 mag, fov 40 deg) observations in Aachen/Germany on Dec. 21/22, 2000.
         MOLSI                        AVIS
 Time [UT]   #URS  #SPO   Time [UT]   #URS  #COM  #SPO
------------------------------------------------------
                         18:33-19:00    0     0     1
                         19:00-20:00    1     0     0
                         20:00-21:00    0     0     5
                         21:00-22:00    1     0     3
                         22:00-23:00    1     0     0
                         23:00-00:00    1     0     6
                         00:00-01:00    0     0     8
                         01:00-02:00    2     0    13
02:20-03:00    4     3   02:00-03:00    3     3     8
03:00-04:00    2     4   03:00-04:00    1     0    11
04:20-05:00    4     5   04:00-05:00    6     0    11
05:00-06:05    8     6   05:00-06:00   10     0    11
                         06:00-06:30    5     0     5
------------------------------------------------------
  3h 25m      18    18     11h 51m     31     3    82


Meteor brightness distribution (MOLSI)
    -2 -1  0 +1 +2 +3 +4 +5 Sum
-------------------------------
URS  1     1  2  3  5  6     18
SPO     1        5  6  4  2  18


Best wishes,
Sirko


--
**************************************************************************
*  Dipl.-Inform. Sirko Molau                  *                          *
*  RWTH Aachen, Lehrstuhl fuer Informatik VI  *              __          *
*  Ahornstr. 55, D-52056 Aachen, Germany      *       " 2B v 2B "        *
*                                             *                          *
*  phone: +49-241-8021615                     *             Shakespeare  *
*  fax  : +49-241-8888219                     *                          *
*  email: molau@informatik.rwth-aachen.de     *                          *
**************************************************************************
*  www  : http://www-i6.informatik.rwth-aachen.de/Colleagues/molau       *
**************************************************************************
Jiri Borovicka
According to the information of P.Pecina, the Ondrejov backscatter radar detected no enhanced meteor activity during the time of the predicted Ursid outburst (Dec 22, 6-9 UT).
The planned double-station video observations could not be realized because of an unexpected low cloud cover over the Czech Republic. Video and visual observations were performed from a single mountain station between 2:30-5:30 UT. No unusual activity was seen, the Ursid ZHR was estimated to be of the order of 10-20.
Jiri Borovicka
Masaaki Takanashi
Ursids 2000 prompt report -Update-
Visual results in Japan (The Nippon Meteor Society).

ZHR has been computed with:
-  gamma = 1.0 (correction of Radiant elevation)
-  r = 2.5  (equal "IMO Shower Circular")
-  excluding:observations under unfavourable condition
   (T<30m, Lm<4.5mag, Cl>0.4, RP-h<10deg)
-  Err. : ZHR * 1/SQRT(#URS)

r(population index) number changed. (3.0 -> 2.5)


Hourly ZHR
----------------------------------------------------------------
Time[UT]    SunL   Obs  T.eff  #URS   ZHR   Err.  (HR)   Remarks
----------------------------------------------------------------
Dec. 2000
21d 12:30  269.959   1   1.25     1     5     5  (  1)
21d 13:30  269.991   1   1.00     2    10     7  (  2)
21d 14:30  270.033   2   1.83     3     6     3  (  2)
21d 15:30  270.076   3   3.00     4     4     2  (  1)
21d 16:30  270.118   2   2.00     3     4     3  (  2)
21d 17:30  270.161   2   2.00     4     6     3  (  2)
21d 18:30  270.203   2   1.50     2     4     3  (  1)

22d 08:45  270.808   4   2.00    13    42    12  (  7)
22d 09:30  270.840  10   8.78    73    41     5  (  8)
22d 10:30  270.882  10   9.13    56    25     3  (  6)
22d 11:30  270.925   6   6.00    45    26     4  (  8)
22d 12:30  270.960   4   2.83    15    17     4  (  5)
22d 13:30  271.010   2   2.00    12    10     3  (  6)
22d 14:30  271.052   8   7.75    20    12     3  (  3)
22d 15:30  271.095   4   4.00     8     2     1  (  2)
22d 16:30  271.137   3   3.00    12     6     2  (  4)
22d 17:30  271.180   2   2.00     8     3     1  (  4)
22d 18:30  271.222   2   1.50    10     6     2  (  7)
22d 19:30  271.264   3   3.00    11     4     1  (  4)
22d 20:30  271.307   3   2.67    11     6     2  (  4)

23d 12:30  271.986   1   1.00     2     8     6  (  2)
23d 13:30  272.029   2   1.67     2     3     2  (  1)
23d 14:30  272.071   2   1.75     1     2     2  (  1)
23d 15:30  272.114   0    -       -     -     -  (  -)
23d 16:30  272.156   0    -       -     -     -  (  -)
23d 17:30  272.198   0    -       -     -     -  (  -)
23d 18:30  272.241   1   1.00     2     4     2  (  2)
23d 19:30  272.283   3   3.33     3     2     1  (  1)
23d 20:30  272.326   3   2.83     3     2     1  (  1)
----------------------------------------------------------------

Observers (24members) :
Seiji AKAGI, Daiyu ITO, Hiroyuki KATO, Noriko KOBAYASHI, Wakaba KOBAYASHI,
Kumiko KOUSAKA, Karimu KURAGAKI, Katsuhiko MAMETA, Yukihisa MATSUMOTO,
Hidekastu MIZOGUCHI, Minoru MURAKI, Tetsuya NAKAMURA, Yoshiko NAKAZAWA,
Hiroyuki NISHIMOTO, Kazuhiro OSADA, Mitsue SAKAGUCHI, Satoshi SAKAI,
Koetsu SATO, Mikiya SATO, Tomoko SATO, Yasuo SHIBA, Kazuhiro SUMIE,
Masafumi SUZUKI, Yasuhiro TONOMURA

Total observations          :  4,730 min. (= 78.83h)
Total number of URS meteors :    326

See more details showing at :
     http://www.nms.gr.jp/en/index.html
     http://www.nms.gr.jp/nmsnews_e.html
     http://www.nms.gr.jp/urs0001.gif

-----------------------------------------------------------------------
Masaaki Takanashi  (The Nippon Meteor Society / Gotemba city, JAPAN)
                                   E-Mail : takanashi@nms.gr.jp
The Nippon Meteor Society's Web page : http://www.nms.gr.jp/en/
 (New URL! Please change your bookmark and linkspot in your Web site.)
-----------------------------------------------------------------------
Juergen Rendtel
The 2000 return of this shower was eagerly awaited because an enhanced activity was expected. Indeed, the rates were significantly higher than the average. The last reported Ursid activity enhancement occurred on Dec. 22, 1996 at solar long. 270.7 with ZHR of the order of 30.
In 2000 the conditions were good as the Moon was almost new. The long northern nights allow a good overlap. Unfortunately, this first summary indicates that the most interesting period is not well covered. Most European observers had to finish around 6h UT (morning twilight). The number of North American data is scarce so far. As a consequence, we cannot yet achieve a good profile. Below find the preliminary data. The high ZHR at the end agrees with Japanese data published here before, although the errors are still quite large.
We are very grateful to the following 15 observers who sent in their reports in time for this first activity overview:
ARLRA Rainer Arlt (Germany)
BADPI Pierre Bader (Germany)
BUCAN Andreas Buchmann (Switzerland)
CANED Ed Cannon (USA)
ENZFR Frank Enzlein (Germany)
HOSDA Dave Hostetter (USA)
LANMA Marco Langbroek (Netherlands)
LUNRO Robert Lunsford (USA)
LUTHA Hartwig Luthen (Germany)
MOLSI Sirko Molau (Germany)
OSAKA Kazuhiro Osada (Japan)
PUNMI Milesh Puntambekar (India)
RENJU Jurgen Rendtel (Germany)
STOEN Enrico Stomeo (Italy)
ZHUJI Jin Zhu (China)

------------------------------------------------------
Date   Time (UT)  Sollong nObs nIND  nURS     ZHR
------------------------------------------------------
Dec 22    0240    270.553   5    4     16   5.1 +- 1.2
    22    0330    270.586  12    9     46   8.2    1.2
    22    0410    270.620  16    9     76  12.7    1.5
    22    0510    270.658  16   10    104  19.6    1.9
    22    0535    270.676   8    6     58  26.1    3.4
    22    0935    270.847   2    2     29  53     10
Solar longitudes refer to equinox J2000.0. nObs is the number of individual observing periods, nIND is the number of individual observers providing them, nURS is the number of Ursids seen. The population index used was r=2.5. The expectation value of the ZHR,
ZHR = (1 + sum nGEM) / sum(Teff/C),
was used for the averages here, where Teff is the effective observing time and C is the total correction composed of limiting magnitude, clouds, and zenith correction [sin (h_R)]. Times are rounded to the nearest 10 minutes.
Juergen Rendtel
25 Dec 2000
************************************************************************
Juergen Rendtel                          Astrophysical Institute Potsdam
jrendtel@aip.de                                      Telegrafenberg A 27
Phone: (+49) 331 - 288 2327 (office)              14473 Potsdam, Germany
Fax:   (+49) 331 - 288 2310
http://aipsoe.aip.de/~rend/rnl-p.html

                                       International Meteor Organization
Phone: (+49) 33208 - 50753  (priv.)   Seestr.6, 14476 Marquardt, Germany
************************************************************************
Gary W. Kronk
Some extremely high errors in these visual observations and these ZHR's do not seem to match those from other observers' data in the United States, including California. You can not judge a meteor shower's visual strength by such hit and miss observations.
Since the prediction was for faint meteors I can see the reason for the use of intensified video cameras. But how does the data from these cameras compare with other video intensified observations of the Ursids from previous years? I would be very interested in seeing what the "normal" rate would be for the Ursids with such equipment.
Tony Phillips
It strikes me that the visual observations may not be the key data here. Instead, it's the the radio activity profiles that tell the tale of the 2000 Ursids. See http://leonid.arc.nasa.gov/leonidnews29.html. It would indeed be interesting to compare those data to similar observations from other years, but perhaps the more important comparison is how the data match Jennisken & Lytennin's predictions, which are based on a physical model of the debris stream. They seem to agree agree pretty well.
I would also like to see some data well away (geographically) from Finland to confirm the peak -- there's always a chance that local propagation anomalies can mimic a radio meteor outburst.
Gary W. Kronk
The radio activity profiles would be interesting to compare. I am a bit surprised that only normal activity was recorded by the Ondrejov backscatter radar from 6-9 hours UT on December 22, while Ilkka Yrjola (Kuusankoski, Finland) reports that rates of radio meteors began increaseing after 4 hours UT and shot up just after 8 hours UT.
My interest in this year's Ursid rates are not necessarily to support my prediction of just normal activity because of the effects of Jupiter's perturbations on the entire Tuttle/Ursid stream every 11.86 years, but also because this has been one of the best monitored Ursid displays ever.
We know the two significant Ursid outbursts in 1945 and 1986 were very prominent for visual observers, yet this year's visual display was not as spectacular. So, how do the radar/radio-echo reports of the past compare to this year's display?
I have saved all of Christian Steyaert's "Radio Meteor Bulletins" for the last few years. I called up the report for December 1999. The Ursid maximum was expected to occur around December 23 at 0 hours UT. Pierre Terrier (Canet, France), was monitoring a frequency of 102.5 MHz. He reported hourly rates of 0 to 22 meteors for every 24-hour period from December 16 (0 hours UT) to December 22 (14 hours UT). Beginning on December 22 at 15 hours UT, the hourly rates climbed to 34 and remained above 25 per hour until December 23 at 6 hours. During that interval, the highest rates were 132 and 145, which were recorded at December 22, at 21 hours UT, and December 23, at 2 hours UT. These rates were the highest he recorded for the entire month of December 1999, even higher than the Geminids which did not exceed 97 per hour. The entire activity curve is very comparable to that of this year's curve reported by Ilkka Yrjola, but centered around last year's expected maximum.
Now let's look at Yrjola's rates for last year. Instead of me trying to summarize, here is the table of data copy and pasted out of Steyaert's bulletin.
                     Ursids 1999

   Meteor counts in one hour intervals starting at:

     UT  | 20 Dec   21 Dec   22 Dec   23 Dec
     ----+----------------------------------
      0h |    168      172      199      213
      1  |    183      162      259      216
      2  |    192      200      199      179
      3  |    211      156      165      183
      4  |    207      232      216      203
      5  |    263      252      271      236
      6  |    321      274      293      301
      7  |    240      333      276      267
      8  |    307      483      278      261
      9  |    229      379      336      190
     10  |    351      220      290      247
     11  |    415      400               304
     12  |    287      472               266
     13  |    241      619               208
     14  |    215      193               159
     15  |    151      179               175
     16  |    159      150               141
     17  |    155      149               155
     18  |    141      245      219      155
     19  |    190      170      186      160
     20  |    197      198      279      174
     21  |    168      239      285      235
     22  |    189      242      270      225
     23  |    183      235      306      177
     ----+----------------------------------
     UT  | 20 Dec   21 Dec   22 Dec   23 Dec
. tropo on Dec 22, 11h - 18h UT
Ilkka Yrjola
(my addition here is that the frequency was 88.8 MHz)
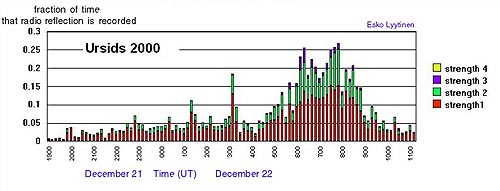
For the 2000 Ursids (see the link at http://leonid.arc.nasa.gov/leonidnews29.html), Yrjola's data indicates a strong increase in activity at 4 hours UT, which persists in varying degrees until 14 hours UT. Look at the table above. For December 20, 1999, the rates from 5 hours UT through 13 hours UT are higher than any other time on the 20th, with a peak at 415 per hour. For December 21, the peak from 5 hours UT through 13 hours UT are higher (with one exception) than any of the earlier or later times on the 21st, with a peak of 619 per hour. High rates are also present for the same period on the 22nd, before the system was down, and you can once again see the highest rates during the same time period on the 23rd. So Yrjola's own data either indicates similar Ursid peaks in 1999 as in 2000, with a periodic persistance that lasts at least 4 days in 1999, or rates that increase and decrease because of some environmental condition.
This is something we need to straighten out if we are to fully understand what happened with the Ursids in 2000.
Mike Linnolt
The visual observations reported here paint a very confusing picture of the Ursids "peak" around 07:30 UT Dec. 22.
Some observers report enhanced activity:
Peter Jenniskens wrote:
"The Ursid shower did flare up significantly last night between 5 UT and9:30 UT,
with a peak around 7:20�10 UT, close to the predicted maximum at 7:29 UT."
Marco Langbroek wrote:
"the trends suggest a peak near 7:30 UTC indeed, as predicted by Peter and Esko,
with peak rates (interpolated) probably around ZHR ~75."
Even one estimate at ZHR=200!
Obs: Peter Gural UTC Teff Lm Urs Spo ZHR(Urs) 08:01-08:10 0.15 6.2 10 2 200�65
Of course, this was just a 9 minute Teff! Periods less than 20 or 30 mins for a lower activity shower may be subject to severe statistical fluctuation.
ON THE OTHER HAND others reported little activity:
Robert Lunsford wrote:
"Rates were quite low the first two hours and the expected maximum came and went without much activity."
Dan Taylor reported from Ontario:
>Ursids
>*all times in EST
>                    Ursids     mag             Lim. Mag.
>8:10-8:35           0          -               5.5
>2:14-2:43           2          3m,4m           6.0
>3:15-3:46           3          3m,5m,5m        6.0
>4:14-4:31           1          5m              6.0
Eric Flescher reported from Kansas:
"...the skies were crisp clear and the weather really cold.
I went out and at 1:38 so a beautiful slow moving fireball (mag -3),
Otherwise saw 2 other sporadic 2 magnitude but no ursids. Since
the storm seemed not to show , I retired 30 minutes later."
In addition, the Czech Ondrejov backscatter radar did not show any enhanced activity from 06:00 - 09:00 UT.
MY OBSERVATIONS under pretty good conditions (LM 5.6 6.1 6.0) covering the peak period from 05:40 - 08:30 UT also showed very low rates, well below Sporadic. Even adjusting using my pretty big correction factors like 7 and 4, my best ZHR only hit 14.3, and the "peak" hour from 06:50 to 07:52 had only 1 URS which converts to a 3.8 ZHR! Unfortunately, I quit at 08:30 UT so cannot confirm the Ursid mini-outburst between 08:00 - 09:00 UT that Robert Lunsford observed.
I don't know what to conclude from these divergent reports around the same "peak" time of 07:30 UT on Dec 22? Some observers saw fairly decent activity, other practically none. I suppose it could be attributed to statistical variation, but the differences are quite large for that. Another possibility could be a very "clumpy" meteoroid stream. Rather than being typically distributed in space like most others, this Ursid stream may have had locally denser patches interspersed with relatively sparse areas. This could explain the large differences in visual rates seen at various locations. But would it explain the lack of enhancement by backscatter radar? I don't know enough about the FOV or volume of space covered by this device to judge if it could distinguish such variation.
I guess we should wait and see what the final report conclusions are from everything submitted to IMO for this weird shower.
Sirko Molau
Hi Mike,
> I guess we should wait and see what the final report conclusions
> are from everything submitted to IMO for this weird shower.
well said. I fully agree with you!
What I find most surprising is that many European observers saw more or less increasing activity towards the end of their observing window at 6 UT (you read the reports of Rainer, Marco and me), whereas most of the Americans reported only low activity at the given time. The European increase cannot be due to a raising radiant, since that translates only into a different digit behind the point in the correction factor.
We have clear enhancements in video data (see my and Peter's report), but no indication of increased actitivy in reliable radio data like the Ondrejov backward scatter, which easily picked up recent outburst like the Draconids. That's all very strange...
Richard Taibi
I have had two reactions.
Peter Jenniskens' use of radio, video, and spectroscopic data to
detect and analyze the outburst is a "wake-up call" to visual meteor enthusiasts.
I have been in the habit of thinking meteor showers mean naked eye observation.
But Dr. Jenniskens' recent study points out the limitations of purely visual
studies. If you were like me, you were disappointed when Jenniskens' prediction of
an outburst did not result in a naked eye extravaganza like the outbursts of 1945
and 1986. Initially, I was incredulous that an "outburst" could occur yet be mostly
invisible to the naked eye. However, after some thought, I realized that meteor
observation has progressed, like other branches of astronomy, to the use of
non-visual wavelengths and to detectors other than the human retina. No longer is
the naked eye magnitude, visual wavelengths meteor the only measure of meteor flux.
Now,I have been aware of a few workers who watch telescopic meteors and that there
are a few radio meteor recorders out on the "periphery" of meteor work. However,
I didn't pay much attention to them. To me, naked eye meteors were where "it was at".
It seems I was in denial however! The Finnish and Californian radio data in
Jenniskens' paper made me realize that naked eye observations are only PART of what
is important data. Radio data also make me realize that the primacy of "low tech"
eyeball and lounge chair observation is on the wane. In light of Dr. Jenniskens'
outburst declaration, visual counts seem to be insufficient as the arbiter of
meteor wisdom now. To do a complete survey of a shower's performance, requires
technology which most of us have not used and do not possess. Radio and CCDs are
an important part of the future of meteor studies. The rules of the game are being
rewritten by Jenniskens et al. Actually, they are being rewritten by the requirements
of comprehensive investigation, Jenniskens is only the "messenger". Having written
all this brings me to my second reaction.
How do we know that 2000's radio rate surpasses the "average"? Dr. Jenniskens has defined the 2000 outburst by saying that the radio rate has greatly exceeded the usual, average, VISUAL rate. But, is it sufficient to say that a radiometeor rate that surpasses a known visual rate constitutes an outburst? In what way are visual rates comparable to radio ones? I believe we can only compare observations in the same wavelengths, that is, visual with visual, and radio with radio. Or, we need an algorithm to be able to compare dissimilar wavelengths. Have there been studies which show us how to compare visual with radio rates? Perhaps one of the meteorobs audience can cite one. In addition, how do we know that this year's radio rate is truly outstanding? Perhaps 2000's rate only matches that of previous years. Can radio observers of several past Ursid maxima help us out here? Is there a radiometeor baseline which will permit us to categorize this year's rate? Such information would help me to accept the legitimacy of this year's "outburst".
Hartwig Luethen
Hi,
it appears that the question of the rate of any Ursids 2000 outburst is still controversal. Thus I decided to have my own look on the 1405 dust t rail that is proposed to be the source of the 2000 Ursids, and to compare the results with the situation at the 1945 and 1986 outbursts.
For this I first integrated the orbit of P/Tuttle back to 1378, 1392 and
1405, using the orbit from the JPL database, allowing for nongravitational
terms A1 and A2 and for the gravitational effects of the planets. These epochs have been
suggested by Jenniskens and Lyytinen as the perihelon passages at which the
particles for the 1986, 1945 and 2000 displays have been released. Then I
generated orbits of test particles having the orbital elements of the comet
at perihelon, but different semimajor axis, and integrated those orbits to
the present time (using the gravitational effects of the major planets except
Pluto).
Computation times were quite lengthy on my 366 MHz Celeron PC. For the
integrations I used the orbit integrator K11, Version 3.0 by Christian
Glowinski at an accuracy factor of 50 (for the comet integration) or 25 (for the trail computation). Software for generating the
input batch jobs for K11 and for analysing the output files were written by
myself.
I plotted the resuling rD-rE values as a function of perihelon time; this type of plot giving a rapid overview over even the most chaotic trails.
In contrast to Leonids or Draconids, these ancient dust trails are far from well-behaved lines. See fig1met.gif for an example of the hopefully storm-producing 1866 Leonid trail. Arrows mark the perihelon passage times of particle arriving at the node of their orbits at the same time as the earth. For a storm, a high density of data points with rD-rE values close to zero should occur at these critical times - a requirement obviously met for 2001 and 2002.
With the Ursids, there are sometimes more or less well-shaped conserved trail fragments. In other cases a chaotic cloud of particles is all that remains from an old trail . This makes predictions sometimes very diff�cult, since even neighbouring particles in this cloud may have different orbital elements, eg. nodal lengthes.
In 1945 we crossed a more or less well-behaved trail fragment (Fig2met.gif, vertical line marking the critical time). The result was a nice ZHR 120 shower as observed by Slovak astronomers. The computed maximum from my model, Dec. 22, 18:29 UT, is compatible with the curve plotted in Jenniskens A&A paper (however the decending arm of this curve remained unobserved).
In 1986, we crossed the less dense parts of a chaotic cloud instead (Fig2a.gif). Most of the data points scattered around the crossing point have nodal longitudes equivalent to Dec. 22, 21:20-21:40. The published maximum is around 21:35, well compatible with this. Some data points are for earlier times (18:49-20:49 UT). In fact, Jennsiskens curve displays a period of elevated activity before the main peak, that reached a ZHR of 160. I'll compute a higher resolution version of this graph, this will require time, but may help.
Now look at 2000! (Fig3met.gif) Again a quite chaotic picture, we pass outside the main cloud, but close to a trail-like structure. However, close inspection reveals that this trail does not extend to the crossing point with the earth. Thus it requires non-gravitational effects to bring some of these particles into collision with the earth. Note that the time axis in these plots represents a much larger distance scale than the rD-rE axis !
The points at the end of this fragment have nodal longitudes corresponding to 7:27 UT, close to the 7:29 predicted by Jenniskens and Lyytinen.
From this pictue I would expect a much reduced rate, if any, when compared to the 1945 display, It appears that at both the 1986 and the 2000 displays we are close to the limit of the predictive power of such models. One can alert observers based on this kind of computations, but one should be aware that everything is much less secure than with the Leonids - where published rate predictions already tend to differ by an order of magnitudes.
Thus it may be that in 2000 there was really a shower, but at a reduced rates when compared to 1945, and perhaps with a magnitude distribution favoring faint meteors. Are there any telescopic observations close to the predicted time? Does the chzech radar record fainter of brighter meteors than Lyytinens radio observation ?
Daniel Fischer
As a 'veteran' of the 1998 and 1999 Leonids, being part of the combined professional and amateur efforts to make the most of these rare events, I beg to differ from Richard Taibi's assessment: Visual meteor observations are still the baseline to which all other methods have to measure up. This became especially evident during the 1999 Leonid storm when
- only the visual observations by (experienced) amateurs where able
to get the strength of the outburst (measured as the ZHR) to within
better than 50% of what was eventually considered the true value, while
- all the hi-tech techniques employed around the world delivered values
that were either off by a factor of 2-3 or even more (this from automated
or semi-automated computer analysis of intensified video), or
- gave results that are still highly confusing, even a year later (this
refers both to radar and radio techniques where antennae were listening
to the radio emissions of the meteors themselves).
These bold statements above are based mostly on what I learned at the April 2000 Leonids conference in Tel Aviv (see my report in the 2nd story of http://www.geocities.com/skyweek/mirror/186.html for some impressions) - the most memorable moment was when a USAF representative freely admitted during his talk that the visual amateur data obtained during the Leonid storm were better than what the military guys had been able to achieve!
Now I'm not talking about the exciting basic science that has come out of the professional Leonid 1998 and 1999 campaigns, esp. the airborne ones (the spectroscopic results are totally outstanding) but about the real-time meteor rate determination (for 'situational awareness'). Since that had been the main reason for the USAF to fund its million-dollar campaigns in both years, the message was clear, and the military dropped out of the Leonid business.
For us civilians remaining, the task is now to make the best of all techniques available, and the next best thing supporting the visual observer is video, of course, closely followed by radar techniques of all kinds (monostatic and bistatic). The wonderful and largely consistent data obtained during the Leonids of 2000 show that these data sets can be combined quite well, but there are strange discrepancies (e.g. the relative heights of the 3 peaks). On the other hand various radar and video data sets of the 1999 Leonid peak agree extremely well (as could be seen in a recent MNRAS paper) and confirm a lot of fine structure and perhaps even a periodic signal. With the 2000 Ursids, OTOH, the data sets are very discrepant as evidenced by many meteorobs postings (e.g., why didn't the Ondrejov radar see the outburst?) - *much* more work needs to be done!