 Ton Schoenmaker : Forward Scatter Meteor Observations of Geminids Ton Schoenmaker : Forward Scatter Meteor Observations of Geminids |
 Frans van Loo : Visual Observations of Geminids Frans van Loo : Visual Observations of Geminids |
 Geminids 2000 : IMO Shower Circular Geminids 2000 : IMO Shower Circular |
 Geminids 2000 : NASA Science News Geminids 2000 : NASA Science News |
Ton Schoenmaker, Roden
Observer:    Ton Schoenmaker
Location:    Roden, Netherlands (06 26' E, 53 08' N)
Frequency:   55.275 MHz
Transmitter: Spanish TV channel E3 (video); transmitters in La Muela (30 kW),
             Gamoniteiro (50 kW) and Aitana (60 kW); all stations within
             100 Hz of nominal frequency; distance ~1500 km
Antenna:     3-elements horizontal Cushcraft 50 MHz Yagi tuned to 55.3 MHz;
             geographical azimuth 210 degrees (SW)
Receiver:    Yupiteru MVT-9000 in USB mode; sensitivity 0.5 uV at 12 dB S/N
Observing:   800 Hz audio signal from earphone socket was rectified, digitised
             and fed into a PC via the parallel computer port. HP VEE was used
             to process the digitised signal and to store 15-minutes counts of
             reflections stronger than 0.22 uV (-120 dBm). Also for all
             individual meteors date, time, duration (dead time) and maximum
             signal are stored.
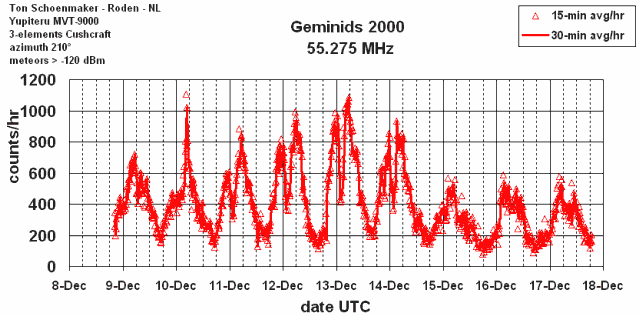
Figure 1 shows the uncorrected results of forward scatter observations of the Geminids. Most striking feature is the sharp dip in the number of counts around 2h UTC. This dip is due to low observability at that time, as radiant and transmitters are in the same direction. Around 13 December the Geminids activity was at its maximum. The counts on 15, 16 and 17 December show the sporadic background.
A remarkable spike was observed on 10 December at about 5h UTC. It not clear yet whether this enhanced activity was real, although propagation effects at that time of the day are very unlikely.
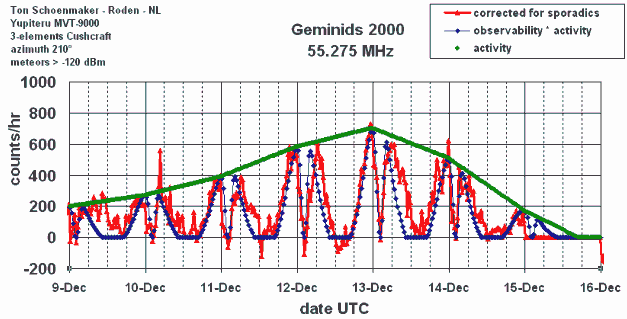
Figure 2 shows an attempt to correct the observations for sporadic background and observability function. As can be seen, the fit between observations and observability is not perfect, especially for the period after the dip. The activity profile is asymmetric with a slow rise probably starting before 9 December and a steep decrease after 14 December.
Ton Schoenmaker, Dutch Meteor Society and IMO
Meester Homanstraat 8, NL 9301 HP Roden, Netherlands
E-mail: schoenmaker@NFRA.nl
Call: PA0EFA


Frans van Loo
The night of 12/13 december stormy winds blows from West. At 4h30m UT I began to observe. Pointing to the east at 40° alt. 20% clouds bright sky and moon. Limiting magnitude at 40° 4.0.
The results:

4h40m-5h00m UT: 5 Geminids and 1 others

5h15m-5h35m UT: 2 Geminids and 1 others

Magnitude distribution of the Geminids observed:

0   1   2   3   4   5
---------------------
-   1   4   2   -   -

At 5h35m 75% clouds again and end of observations.
05°30'E - 51°00'N - height 80m.
F.R. van Loo
G.Lambertlaan 52
B3600 Genk Belgium.
089 84 11 30.
fransvanlo@be.packardbell.org
Geminids 2000
The 2000 return of the strong shower reached its maximum under poor (moonlit) circumstances, restraining many observers from meteor watches. The currently available data show no unusual activity level or any peculiarities, but the near-maximum period is not (yet) well covered with data. So the list given below is a first, preliminary information only. Most observations were carried out under very poor skies. So a maximum correction factor of 7 was allowed, and all observations with the radiant more than 25 deg above the horizon were included. Although the (northern) nights are long and the radiant is above the horizon for (almost) the entire night, there are gaps which may become filled with further data. A list of observations was published by the NMS, but has not been included here at this stage.
We are very grateful to the following 17 observers who sent in their reports in time for this first activity overview:
DETPE Peter Detterline (USA)
GEOPE Petros Georgopoulos (Greece)
GLIGE George W. Gliba (USA)
GRALE Lew Gramer (USA)
KULRH Rhishikesh Kulkarni (India)
LI DO Dong Li (China)
LINMI Michael Linnolt (USA)
MCBAL Alastair McBeath (UK)
PUNNI Nilesh Puntambekar (India)
PURTU Tushar Purohit (India)
RENJU Jurgen Rendtel (Germany)
SHAJA Jason Shanley (USA)
SHASH Shashank Shalgar (India)
SPAGE George Spalding (UK)
TAIRI Richard Taibi (USA)
TRIJO Josep Trigo-Rodriguez (Spain)
WANSO Song Wanfang (China)

------------------------------------------------------
Date   Time (UT)  Sollong nObs nIND  nGEM     ZHR
------------------------------------------------------
Dec 13    0340    261.43    4    3     15    55 +- 13
    13    0600    261.55    5    5    134    68     8
    13    2000    262.12    3    3     24   118    20
    13    2130    262.19    3    3     86   124    12
    13    2240    262.24    3    3    102   126    11
    14    0310    262.43    3    3    181   122     9
    14    0850    262.67    1    1     10    79    24
    14    2020    263.16    2    2      7    33    10
Solar longitudes refer to equinox J2000.0. nObs is the number of individual observing periods, nIND is the number of individual observers providing them, nGEM is the number of Geminids seen. The population index used was r=2.5. The expectation value of the ZHR,
ZHR = (1 + sum nGEM) / sum(Teff/C),
was used for the averages here, where Teff is the effective observing time and C is the total correction composed of limiting magnitude, clouds, and zenith correction [sin (h_R)]. Times are rounded to the nearest 10 minutes.
Juergen Rendtel
18 Dec 2000