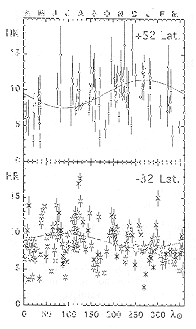
 Annual variation of sporadic activity.
Taken from: Jenniskens P, 1994: Meteor stream activity I.
The annual streams. Astronomy and Astrophysics 287, 990-1013.
Members of DMS conduct visual observations on meteor activity both during the periods
of main stream activity and during the quiet off season. Visual observations by DMS members have
been used for defining the sporadic background activity and for constructing activity curves
for the major and many minor streams. The results have been published in the journal
Astronomy and Astrophysics by Peter Jenniskens (Vol. 287 (1994), p. 990-1013).
At this moment, and sparked by recent papers on this subject written by Dr. Jenniskens,
some members are quite vigouriously hunting for unanticipated stream outbursts. Many hours
are spend monitoring off season activity for this purpose. And sometimes with success, for example
in the case of the unanticipated Orionid 'far comet type' outburst of 1993 and the Canis
Minorid activity of January 17, 1993. Other outbursts observed by DMS-members include the
Perseid outbursts of 1992, 1993 and 1994 and the Leonid outburst of 1994.
DMS visual observations are reduced according to the procedures outlined in the 1994
Astronomy and Astrophysics paper. Plotting meteors on gnomonic maps is a common habit
among most observers for the periods outside peak activity of major streams. A set of 8
gnomonic maps in an ecliptic arrangement was specially designed for this purpose
by M. Langbroek. The maps (format A-3) were extensively tested in the field and subsequently modified
before the final versions were constructed. See below.
 |
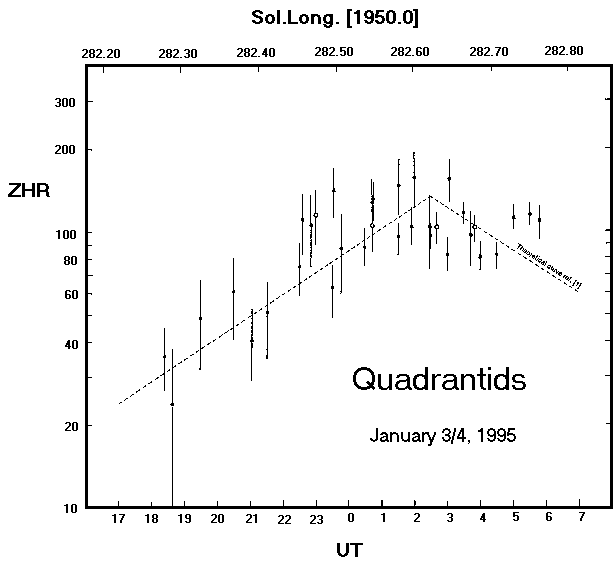
As an example of the activities of the DMS visual section we present the preliminary results of the highly succesfull DMS visual observations on the Quandrantid meteor stream at january 3/4 1995.
 |
Preliminary analysis based on a small sample of the total amount of available observational data.
Observers: Koen Miskotte, Marco Langbroek, Marc de Lignie and
Carl Johannink.
Results: ZHR-max = 150 at sun.long. 282.61 [1950.0]; T-max = 02:15 +- 45m UT; B-value = 2.1; gamma = 1.4

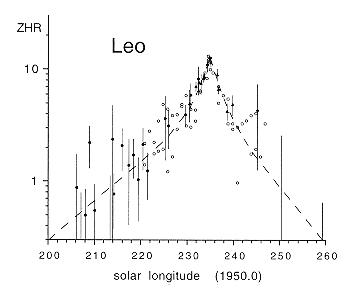
This is a compilation of data from Koseki (1993 - 0), Jenniskens (1994a = ·), and Brown (1994 = triangle).
The ZHR values calculated by Koseki and Brown are scaled to those of Jenniskens by a factor of 0.37 and 1.22, respectively, and deviate in absolute level because of different definitions of the standard observer, the standard sky limiting magnitude, and a different correction for radiant altitude dilution.
Peter Jenniskens: Meteor stream activity. III. Measurement of the first in a new series of Leonid outburst. Meteoritics & Planetary Science 31, 177-184 (1996).

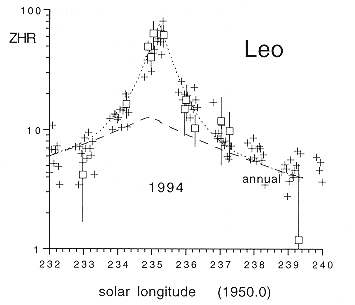
Profile of the 1994 Leonid outburst.
Corrected hourly rates of visual (O) and radio forward meteor scatter data (+). A dashed curve shows the annual activity from the figure above.
Peter Jenniskens: Meteor stream activity. III. Measurement of the first in a new series of Leonid outburst. Meteoritics & Planetary Science 31, 177-184 (1996).