|
|
This page presents an overview on the Perseids 1998 by Peter Bus |
Perseids 1998 Part 1
Results of "Sporadic" Activity
(All Solar Longitudes refer to equinox 2000.0)
The equipment
Meteors were detected by receiving forward-scattered VHF radio waves
at a frequency of 72.11 MHz. The receiver used was a Bearcat UBC 177XLT scanning radio
with a RF sensitivity of 0.5 microvolts for a signal to noise ratio of 12dB and an IF
selectivity of 50dB at approximately 25 kHz.
The transmitter, a Polish broadcast station is located in Wroclaw, the receiver is
located in Groningen, The Netherlands.
The path length between Groningen and Wroclaw is about 740 km. A three-element Yagi antenna with folded dipole was used at the receiving station. The antenna was directed to azimuth 106º (ESE) with an elevation of 13º towards Wroclaw. The main lob of the antenna was directed towards the 100-km level, vertically above the mid-point of the transmitter-receiver path.
The observational data
"Sporadic" activity was observed by listening and counting in 5-minute
intervals on July 5, 6, 11, 18, 19, 25 and August 1, 1998.
In 1998 the observation period lies between 12h and 19h UT (Solar longitudes 139º.61 - 139º.89
on August 12).
This was in 1996 and in 1997 the period of the highest rates in the "new" peak with a
maximum at solar longitude 139º.67 in 1996 and at 139º.69 in 1997.
Mean "sporadic" activity between July 5 and August 1, 1998.
Between brackets the statistical error of one sigma (n-1).
Hour rates starting at UT:
12h         13h         14h         15h         16h         17h

80 (± 14)   64 (± 8)    64 (± 10)   67 (± 13)   74 (± 10)   75 (± 8)
The "Sporadic" activity is almost the same as observed in 1997.
Mean "sporadic" activity of long-duration reflections >1 sec
(= visual bright meteors) on July 5, 6, 11, 18, 19, 25 and August 1, 1998.
Between brackets the statistical error of one sigma (n-1).
Hour rates starting at UT:
12h         13h         14h         15h         16h         17h

 7 (± 4)     7 (± 3)     6 (± 2)     6 (± 4)     5 (± 4)     5 (± 2)
Perseids 1998 Part 2
Results of Perseid activity on August 11
Because weak Sporadic-E and other atmospheric (ionosphere?) disturbances only the results of reflections > 1 sec are given (= visual bright meteors).
Uncorrected counts on 1998, August 11
Meteor hour rates starting at UT:
12h        13h        14h        15h        16h        17h

14         16         13         12         13         13
The net values of the Perseids were calculated by subtracting the mean "sporadic" meteor counts as observed during the same period in 1998 between July 5 and August 2 (see part 1). For each hour, this net shower value was divided by the value of the normalised observability function (after Hines) to obtain the estimated true shower activity of the bright Perseids.
Between brackets the statistical error of one sigma with the error of the "sporadic" activity taken into account.
Perseid hour rates starting at UT:
12h        13h        14h        15h        16h        17h

10(5)      13(4)      13(5)      12(5)      17(6)      17(5)
Perseids 1998 Part 3
Preliminary results of Perseid activity on August 12
Because weak Sporadic-E and other atmospheric (ionospheric?)
disturbances only the results of reflections > 1 sec are given (= visual bright meteors).
The counts are not corrected for dead-time.
Uncorrected counts on 1998, August 12
Meteor hour rates starting at UT:
12h        13h        14h        15h        16h        17h

26         28         45         31         16         13
The net values of the Perseids were calculated by subtracting the mean
"sporadic" meteor counts as observed during the same period in 1998 between July 5 and
August 2 (see part 1). For each hour, this net shower value was divided by the value of
the normalised observability function (after Hines) to obtain the estimated true shower
activity of the bright Perseids.
The counts are not corrected for dead-time.
Between brackets the statistical error of one sigma with the error of the "sporadic" activity taken into account.
Perseid hour rates starting at UT:
12h        13h        14h        15h        16h        17h

28(7)      36(7)      69(9)      49(8)      25(6)      17(5)
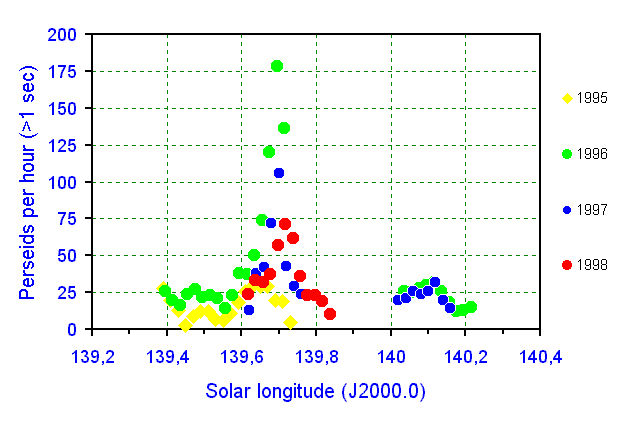
The maximum of the "new" peak is observed around 14h40m UT at Solar longitude 139.71 degrees (2000.0). This is exactly the same position as observed in 1997.
The figure shows the corrected hour rates for 30-minute periods for the Perseids in 1995 (yellow dots), in 1996 (green dots) and in 1997 (blue dots). The red dots marks the 1998 Perseids and are only corrected for "sporadics" and observability function after Hines.

E.P.Bus, Groningen, August 12, 1998.