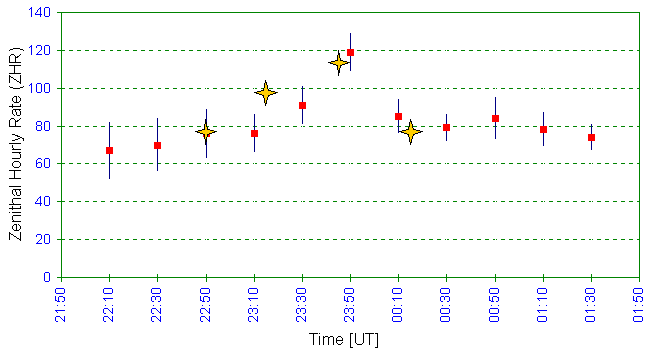
Below some still preliminary results on the enigmatic subpeak in the Perseid profile of August 12-13 that was discovered by Rainer Arlt. Below's ZHR's are based on 5 Dutch observers: Marc de Lignie, Koen Miskotte, Jos Nijland, Carl Johannink and me. The procedure is the well known procedure of Peter Jenniskens, with gamma=1.4 and personal perception coefficients (MISKO:1.2, LANMA:1.4, NIJJO: 1.1, LIGMA:1.0). For JOHCA we experienced some problems in determining a reliable Cp, so I choose to scale his results so that the rates before and after the peak match those of the other observers and the multiyear average. Note that the results of the other 4 observers indeed come out nicely on the multiyear average for those periods. From the magnitude estimates, I derived r by log Nstr/Nspo with r_spo at 3.4. The results is r 2.5 +- 0.2 (with r_spo at 3.0 like IMO uses this would be 2.2).
UT        ZHR   +-
22:10     67    15
22:30     70    14
22:50     76    13
23:10     76    10
23:30     91    10
23:50     119   10
00:10     85     9
00:30     79     7
00:50     84    11
01:10     78     9
01:30     74     7
If you put these ZHR's in a diagram with the Y-axis (the ZHR-scale) logarithmic, the result is really very nice. I interpret it as a peak with ZHR ~40-45 and B~25 superimposed on a background (annual) rate of ~77. The peak might be slightly skewed with a somewhat faster decrease. The result of this is a peak with ZHR ~115-120 at ~23:45 UT (139.627 [B1950])
These results match extremely well the analysis of Rainer in the 2nd IMO shower circular (but note that the datasets overlap for 1/3th! 4 observers in my analysis (MISKO, JOHCA, LIGMA and LANMA) are also in Rainer's!). Due to a different choice of some constants and our use of Cp's the absolute ZHR's from both analysis differ, but if you scale Rainers results by a factor 1.24 and put them in the same diagram the match is really excellent in shape, slope steepness and relative strength of this peak.

Perseids 1997 subpeak august 12/13, comparing DMS (red squares) and IMO (orange stars) results. Please note: IMO-data are multiplied by 1.24!
This peak is of course the big excitement of this campaign for us. I have taken a look at analysis from previous years, and it seems not present in e.g. the 1993 data. But before taking that for granted I urge analysts to go back to the data of previous years and reduce them in short term intervals instead of the >=1 hr intervals that are usually used.
It becomes crucial to know whether this is an annual feature or not. If not, it might be connected to the recent passage of P/Swift-Tuttle, like the series of outbursts last years!
Regards,
-Marco Langbroek
Dutch Meteor Society
[1] Jenniskens P., 1994: Astronomy & Astrophysics 287, 990-1013