 |
 |
Leonids 1998: Visual Results
Sino-Dutch Leonid Expedition 1998
Hans Betlem and Olga van Mil
Summary
During the period November 13 to November 19, 13185 meteors were observed by a team of 11 visual observers at several locations in the Peoples Republic of China. Table 1 gives a summary of all observers, data, nights e.g.
Magnitude distributions
All observations (counts, limiting magnitudes eg.) en magnitude distributions per night per observer have been archived electronically for further analysis.
About half of the observations was done during the night November 16/17: the famous "Night of the Fireballs" which causes some complications for the reduction. The typical magnitude distribution for this night needs a separated treatment of the data. Almost half of the observed number of meteors were zero magnitude or brighter. A separated determination of the r-parameter for the shower for this particular night is therefore needed.
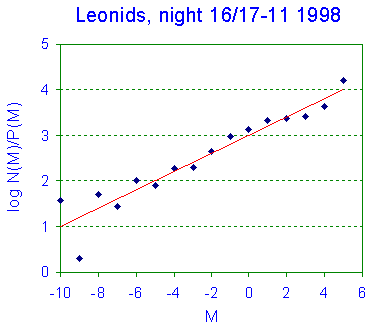
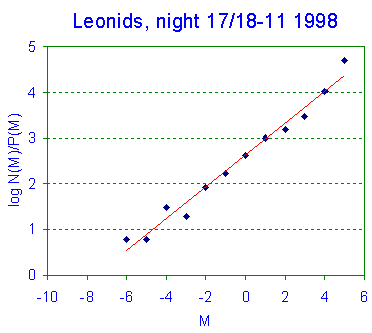
For all observers separated magnitude distributions were computed for the nights 16/17 and 17/18 november, individual r-values per observer and mean r-values per night were computed.Figure 1 shows the log N(m)/P(M) versus M plot. [1]; P(M) values were used from [2]. R can be determined as the inverse log of the slope of the graph.
Table 2 gives the determined values for r per observer and mean values per night. The influence of the high numbers of bright meteors is clearly reflected in the extremely low value of around 1.50 for the individual r-determinations for the night November 16/17. For the "official" maximum night November 17/18 r-values are closer to normal.
ZHR data
Using individual r-values the Zenithal Hourly Rates (ZHR) values were computed for periods of 15 minutes for those periods where sufficient data are available and for periods of 30 minutes for some periods in the first hours after midnight with lower numbers of meteors due to a lower radiant altitude. Individual perception coefficients Cp were derived under assumption that SCp should be 1.0. This implies that the mean of all observations has been taken as standard observer which will yield more reliable results than assuming one (experienced) observer as standard.
Cp values for several observers are also given in table 2. ZHR values are corrected with these values to fit all observers together. One must realize that a Cp value below 1.0 means that the observer noted more than the average numbers of meteors (or underestimated the limiting magnitude and thus overcorrected these numbers) and a Cp value more than 1.0 implies the opposite.
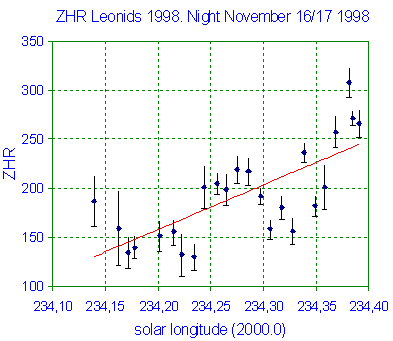
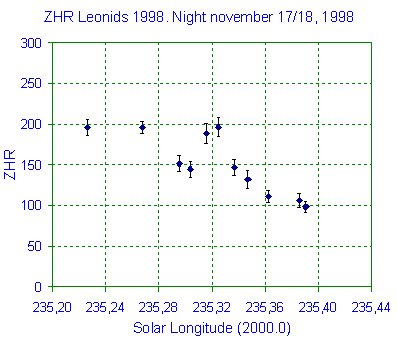
The same values for Cp have been used for the whole observation period.Figures 2 and 3 show activity (ZHR) curves for the Leonids for the nights 16/17 and 17/18, based on all observations using all individual r- and Cp values. The first night shows a steady increase of the Leonid activity up to a ZHR between 250 and 300 in the Chinese morning twilight at solar longitude 234°.40. There is a remarkable dip around solar longitude 234°.32. The second night shows decreasing rates indicating that the highest ZHR took place during the Chinese day time. A significant peak is visible near solar longitude 235°.32.
Figure 4 shows the Leonid activity over the whole period. It is clear that rates stayed below 25 until November 16 and dropped down to about 40 during the night November 18/19.
Flux numbers
The meteor influx is defined as the number of zero magnitude meteors per hour per square kilometer. The flux represents the real number of meteors rather than the observed numbers as is represented in the ZHR. A higher r-value (faint meteors) implies a larger correction from ZHR to flux numbers as a lower number as occurred during the night 16/17 november.
Figure 5 shows the flux numbers for the Leonids 1998 for the nights 16/17 and 17/18 november. The values n(m) represent the total number of meteors in the range from -10 to +5 hitting the earth's surface (1,33 x 10¹⁴ km2) per hour. Flux numbers are much large in the second night, mainly due to the higher r-value.
All relevant data are represented in table 3.Figure 6 and 7 show the flux numbers during both nights. The night 16/16 shows no significant fine structure; the peak at solar longitude 235°.32 during the second night is now even more prominent.
Acknowledgements
Our thanks are due to Peter Jenniskens for critical proofreading of this manuscript.
A more detailed report (in Dutch) can be found in Radiant, Journal of the Dutch Meteor Society, vol. 21 (1999) number 3, page 65 - 71.
References
- Kresakova, M.: Contr. Astron. Obs. Skanate Pleso III (1966) pp. 75
- Jenniskens P.: Meteor Stream Activity I. Astron. and Astrophys. 287(1994) pp. 990-1013
 |
 |
Fig. 1 : Log N(M)/P(M) versus M plots for the nights november 16/17 (left : 4666 magnitude estimates) and november 17/18 (right : 3084 magnitude estimates) show clearly the difference in magnitude distribution index r. Very good magnitude estimates have been done as the correlation coefficients are close to 1 for both nights.
 |
 |
Fig. 2 en 3 : ZHR values for solar longitudes (2000.0) 234°.20 - 234°.55 (night 16/17 november, left) and for solar longitudes 235°.20 - 235°.55 (night 17/18 november, right). R and Cp values from table 2 have been used.
Fig. 4 : ZHR values for the Leonids 1998 from november 13 until november 19. DMS, Peoples Republic of China.
Fig. 5 : Flux numbers for the whole earth surface for the nights 16/17 and 17/18.
Fig. 6 and 7 : Flux numbers for november 16/17 (fig. 6) and november 17/18 (fig 7)
Table 1 : Summary of all visual observations, number of observed nights, number of observed meteors by 11 Dutch observers in the Peoples Republic of China.
Table 2 : Individual R- and Cp values for the nights 16/17 and 17/18 for several observers.
Table 3 : Computed average values for the ZHR and fluxes per solar longitude. For the night november 16/17 r=1.50 was used, for the other nights r=2.32.
| Back to DMS homepage |
This page was last modified on June 2, 1999 by Hans Betlem and Casper ter Kuile |