|
|
|
|
|
|
|
|
|
|
|
|
|
|
|
Definition of an X-RAY BURST.
A temporary enhancement of the X-ray emission of the sun. The time-intensity profile of
soft X-ray bursts is similar to that of the H-ALPHA profile of an associated FLARE.
Definition of the X-RAY FLARE CLASS.
Rank of a FLARE based on its X-ray energy output. Flares are classified by the order of
magnitude of the peak burst intensity (I) measured at the earth in the 1 to 8 angstrom
band as follows:
Class          (in Watt/sq. Meter)
B              I less than (l.t.) 10.0E-06
C              10.0E-06 l.e.= I  l.t.= 10.0E-05
M              10.0E-05 l.e.= I  l.t.= 10.0E-04
X              I g.e.= 10.0E-04
Definition of H-ALPHA.
This ABSORPTION LINE of neutral hydrogen falls in the red part of the visible spectrum
and is convenient for solar observations. The H-alpha line is universally used for
patrol observations of solar flares.
Definition of a PROTON EVENT.
By definition, the measurement of at least 10 protons/sq.cm/sec/steradian at energies greater than 10 MeV.
Definition of a PROTON FLARE.
Any FLARE producing significant FLUXes of greater-than-10 MeV protons in the vicinity of the earth.
Energetic protons can reach Earth within 30 minutes of a major flare's peak. During such an event, Earth is showered with highly energetic solar particles (primarily protons) released from the flare site. Some of these particles spiral down Earth's magnetic field lines, reaching the upper layers of our atmosphere.
Definition of the K INDEX.
A 3-hourly quasi-logarithmic local index of geomagnetic activity relative to an assumed
quiet-day curve for the recording site. Range is from 0 to 9. The K index measures the
deviation of the most disturbed horizontal component.
Definition of the Kp INDEX.
A 3-hourly planetary geomagnetic index of activity generated in Gottingen, Germany,
based on the K INDEX from 12 or 13 stations distributed around the world.
Kp and its related indices (ap, Ap, Cp) have been widely used in ionospheric and atmospheric studies and are generally recognized as indices measuring the effect of energetic charged particles arriving in Earth's upper atmosphere after periods of intense solar activity.
(Electron, Proton, and Alpha Monitor)
The Advanced Composition Explorer (ACE) launched at 10:39 a.m., August 25, 1997
Caltech, Pasadena, California, USA
(Magnetometer & Solar Wind Electron, Proton, and Alpha Monitor)
The Solar Wind Electron, Proton, and Alpha Monitor (SWEPAM) measures the solar wind plasma electron and ion fluxes (rates of particle flow) as functions of direction and energy. These data provide detailed knowledge of the solar wind conditions and internal state every minute. SWEPAM also provides real-time solar wind observations which are continiously telemetered to the ground for space weather purposes.
Electron and ion measurements are made with separate sensors. The ion sensor measures particle energies between about 0.26 and 36 KeV, and the electron sensor's energy range is between 1 and 1350 eV. Both sensors use electrostatic analyzers with fan-shaped fields-of-view. The electrostatic analyzers measure the energy per charge of each particle by bending their flight paths through the system. The fields-of-view are swept across all solar wind directions by the rotation of the spacecraft.
Caltech, Pasadena, California, USA
(Solar Isotope Spectrometer)
The Solar Isotope Spectrometer (SIS) is designed to provide high resolution measurements of the isotopic composition of energetic nuclei from He to Ni (Z=2 to 28) over the energy range from ~10 to ~100 MeV/nucleon. During large solar events, when particle fluxes can increase over quiet-time values by factors of up to 10000, SIS will measure the isotopic composition of the solar corona.
Caltech, Pasadena, California, USA
(in Kp units)
The Costello Geomagnetic Activity Index model was developed by Kirt Costello at Rice University under support from the US Air Force and Sterling Software, Inc. It is a neural network algorithm that was trained on the response of the Kp geomagnetic activity index to solar wind parameters. The model takes the most recent two hours of solar wind data and returns a 3-hour activity index prediction in units of Kp. The valid time of the prediction is indicated on the output graphics by horizontal bars.
From top to bottom, the 4 panels represent the following solar wind proton parameters:
- 1) the bulk speed in kilometers per second
- 2) the density (protons per cm3)
- 3) the most probable thermal speed (km/sec) = Sqrt(2kT/m)
- 4) the flow direction in the plane perpendicular to the ecliptic plane, with positive values indicating flow FROM the south. On rare occassions the spacecraft's roll angle is changed for brief periods, during which the derived flow direction will refer to a different plane. A list of such times is available.
SOHO is never in the magnetosphere and enjoys excellent data coverage. The data on the Web page are typically between a few minutes and a few hours old.
The Mass Time-Of-Flight (MTOF) sensor of the CELIAS investigation is actually two subsensors. The MTOF/Main is the primary unit, providing solar wind elemental and isotopic abundance measurements. The MTOF/Proton Monitor is an auxiliary unit designed to measure the solar wind proton parameters, including speed and direction.
About LASCO and its images:
The Large Angle and Spectrometric COronagraph (LASCO) instrument is one of 11 instruments included on the joint NASA/ESA SOHO (Solar and Heliospheric Observatory) spacecraft. SOHO was launched on 2 December 1995 at 0808 UT (0308 EST) from the Kennedy Space Center, Cape Canaveral, Florida. The LASCO instrument is a set of three coronagraphs that image the solar corona from 1.1 to 32 solar radii. It is convenient to measure distances in terms of solar radii. One solar radius is about 700,000 km, 420,000 miles or 16 arc minutes. A coronagraph is a telescope that is designed to block light coming from the solar disk, in order to see the extremely faint emission from the region around the sun, called the corona.
LASCO (Large Angle Spectrometric Coronagraph) is able to take images of the solar corona by blocking the light coming directly from the Sun with an occulter disk, creating an artificial eclipse within the instrument itself. The position of the solar disk is indicated in the images by the white circle. The most prominent feature of the corona are usually the coronal streamers, those nearly radial bands that can be seen both in C2 and C3. Occasionally, a coronal mass ejection can be see being expelled away from the Sun and crossing the fields of view of both coronagraphs. The shadow crossing from the lower left corner to the center of the image is the support for the occulter disk.
C2 images show the inner solar corona up to 8.4 million kilometers (5.25 million miles) away from the Sun.
C3 images have a larger field of view: They encompass 32 diameters of the Sun. To put this in perspective, the diameter of the images is 45 million kilometers (about 30 million miles) at the distance of the Sun, or half of the diameter of the orbit of Mercury. Many bright stars can be seen behind the Sun.
SOHO is a project of international cooperation between ESA and NASA.
(Solar Terrestrial Dispatch)
(Swedish Institute of Space Physics (IRF))
Canadian Space Agency (CANOPUS)

By Eisse Pieter Bus, Groningen, The Netherlands
In bijgaand figuur is de locale horizontale magnetische afwijking gegeven zoals geregistreerd op 15 juli 2000. De waarnemingen zijn begonnen om 8h45m UT en na 9h UT werd de waarde elk half uur op de schaal van een zelfbouw "magnetometer" afgelezen en geregistreerd.
Deze zelfbouw magnetometer is gemaakt aan het begin van de 90-tiger jaren. Op de achterkant van een 30cm lange naald is een magneetje gemonteerd, terwijl aan de voorkant een zeer fijn lijntje zit die boven een spiegeltje hangt. Op dit spiegeltje is een doorzichtige folie geplakt waarop een schaalverdeling is getekend. Het aflezen gebeurt zodanig dat het lijntje en het spiegelbeeld van dit lijntje precies op ��n lijn bevinden. De schaalverdeling is zodanig, dat op 1 boogminuut nauwkeurig de meting kan worden afgelezen.
De geregistreerde afwijkingen is geen absolute waarde t.o.v. van het ware noorden, omdat ik deze voor Groningen niet precies weet. De magnetometer is op een plek neergezet, en is sindsdien niet meer verplaatst.
Uit de grafiek is op te maken dat na 11 uur UT, de naald onrustig begon te worden waarna rond 13h30m UT een grotere verandering plaatsvond. Gedurende de gehele dag bleef de naald erg onrustig waarop tussen 20h30m en 23h UT de grootste afwijking werd geregistreerd van ca. 1 graad t.o.v. het gemiddelde zoals geregistreerd in mei jl. Deze afwijking was kleiner dan in maart 1991, waarop een afwijking van meer dan 5 graden werd geregistreerd.
Rond de maximale magnetische afwijking op 15 juli rond 22h UT rond werd door Carl en Romke poollicht gezien. De magnetische registratie bevestigt deze waarnemingen. Ook aan het begin van de 90-tiger jaren werd tijdens de maximale afwijking van de magnetometer, poollicht gezien. Vaak werd ik door de magnetometer hierop geattendeerd. Helaas was er nu in Groningen een egale wolkendek waaruit motregende.
By Ton Schoenmaker, Roden, The Netherlands
After the solar flare of 14 July 2000, 10h24m UTC, there was an immediate decrease in the number of forward-scattered radio meteors. No reflections were received between 10h20m and 10h50m UTC. At about 12h00m the activity of radio meteors was back to normal. During the night of 15/16 July counts were lower than normal. This may be caused by the aurora during that night.
The radio meteors are received with an automatic set-up, using forward-scattered signal from TV transmitters (channel E3, 55.275 MHz) in Spain at distance of approximately 1500 km.
By Romke Schievink & Carl Johannink
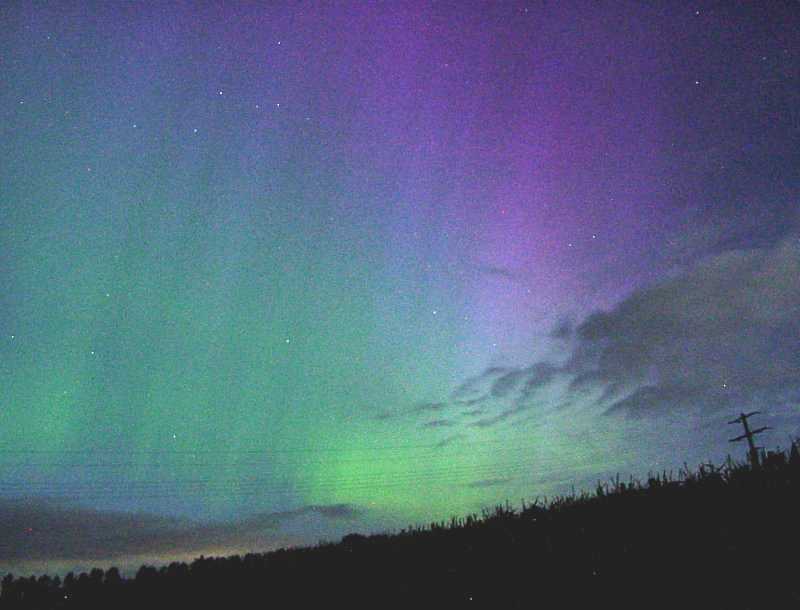
- Date/time: 15 july 2000, +/- 22h15m UT
- Location: Munster / Laer (Germany) - 52� N ; 8� E
- Camera: SONY digital DSC-D770
- CCD-resolution: 1344 x 1044 pixels
- CCD-sensitivity: 400 ASA and diafragma 2.2
- Exposuretime: 4 seconds
By Romke Schievink & Carl Johannink
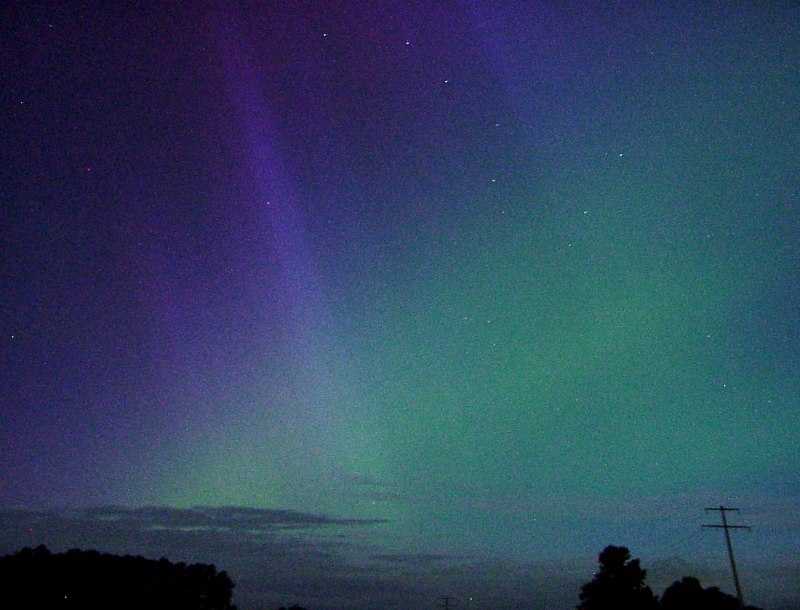
- Date/time: 15 july 2000, +/- 22h15m UT
- Location: Munster / Laer (Germany) - 52� N ; 8� E
- Camera: SONY digital DSC-D770
- CCD-resolution: 1344 x 1044 pixels
- CCD-sensitivity: 400 ASA and diafragma 2.2
- Exposuretime: 4 seconds
Een goede nacht vanuit Gronau.
We zijn net terug van een geslaagde trip naar de omgeving van Munster.
Tegen half twaalf pikte Romke me op, en reden we richting zuidoost naar Munster.
Volgens de deskundige hadden we in die regio wel een betere kans op helder weer dan in Gronau. Op moment van vertrek was het in Gronau vooral in het noordoosten redelijk te doen, maar al rijdende richting zuidoost kwamen we ook vrij vlot onder een heldere hemel.
Na een half uurtje rijden en genieten van een passend stukje muziek werd het tijd om een plek uit te zoeken. Te dicht bij Munster leek ons gezien de lichtvervuiling geen goed plan. We sloegen af richting Laer en vonden een geschikt landweggetje met uitzicht in alle richtingen tot op de horizon.
Al direct na het uitstappen rond 0 uur viel op dat er 'grijze vlekken' zichtbaar waren vooral in het noordoosten onder de Zwaan en in het westen onder de Grote Beer. Dit bleken de eerste tekenen te zijn in de deels nog door de schemering bijgelichtte lucht. Romke maakte de eerste opnamen met zijn digitale camera (de gegevens staan hieronder), helaas nog iets onscherp. We hebben de camera toen maar op de Maan scherp gesteld, was dat ding tenminste ook nog ergens goed voor.
Rond 00:10 (zomertijd) verschenen er rode tinten en strepen in de lucht, en daarna ... tja, daarna ging het dak er af bij ons. Een muur van poollicht bouwde zich op over de gehele noordelijke hemel. Allerlei kleuren waren zichtbaar, vooral het rood en paars knalde eruit. De horizon was een groengele dikke balk van waaruit forse stralen als tentakels richting het zenit priemden. De gevoelens van verbijstering over zoveel fraais tipten qua intensiteit even aan het gevoel wat wij beide hadden toen we twee jaar geleden in de nacht van 16/17 november 'verrast' werden door de vele vuurbollen aan de hemel. De Maan was trouwens absoluut niet storend in die vijftien minuten waarin deze enorme muur te zien was.
Daarna zakte de activiteit in. Intussen nam trouwens ook de bewolking (zoals voorspelt) toe. Er werden nog wel wat grijze stralen gezien richting Kleine Beer, maar dat kon ons toen eerlijk gezegd nauwelijks meer ontroeren. Na het nagenieten verlieten we deze stek rond 1 uur 's nachts en reden terug naar Gronau / Enschede.
Zeeeeeeeeer geslaagd, deze aktie!!
Een speciaal woord van dank aan Jacob Kuiper voor een PERFECTE voorspelling over het gedrag van de bewolking in deze regio.
Gegevens van de camera waarmee zo'n 45 deels zeer fraaie opnamen
gemaakt konden worden : SONY digital DSC-D770 ingesteld op 400 ASA en diafragma 2.2
Alle opnamen 4 seconden belicht ; resolutie 1344 x 1044 pixels.
Beste waarnemers,
Wat te zeggen?
Mijn gemoed schiet eigenlijk vol.
Het was een gedenkwaardige vrijdag en zaterdag 14 en 15 juli 2000.
Hieronder een verslag van alle gebeurtenissen op deze beide dagen waarvan
de afloop inmiddels bekend is maar die toch weer zeer leerzaam is geweest.
In principe wacht ik "gewoon" op de aankomst van de uitbarsting van 11 juli. We weten immers dat deze rond deze tijd zou moeten arriveren. De ACE-snelheids plaatjes, die elke 5 minuten keurig worden ververst, heb ik dan geminiaturiseerd op het scherm staan zodat ik er tussen mijn dagelijkse bezigheden door zo nu en dan even een blik op kan werpen. Een snel oplopende snelheid is meestal de indicatie dat de schokgolf over een uurtje de aarde zal bereiken.
En dan, tegen 13h30m MEZT is het zover: ik zie nagenoeg live de ene indicator na de andere meest loodrecht de lucht ingaan! Diepgaand overleg met een collega die ook zeer in het phenomeen poollicht is geinteresseerd. Er zijn namelijk wat onduidelijkheden die we niet direct kunnen verklaren. Zo valt de snelheid van de electronen juist helemaal terug van een dikke 600 km/sec naar minder dan 300 km/sec. Er klopt dus iets niet. Een beetje wetenschapper wil dan weten waarom, hoe en wat? We verkeren in dit eerste uurtje nog in onwetendheid maar we voelen toch aan dat er "iets" aan de hand is...
Kort daarna meld mijn collega een "probleem" met de SOHO. Dat is dat beeld dat digitaal in de soep is gedraaid. Uit ervaring weet ik dat dat wel eens voorkomt. Heeft niets te maken met eventuele gebeurtenissen op de zon.
Nog weer later haal ik het gecombineerde overzichtsplaatje van www.maj.com
op het scherm. De protonenflux is decaden omhooggeschoten! Dat heb ik
eigenlijk nooit eerder zo gezien. Hier gebeurt iets zeer merkwaardigs!
En pas dan valt mijn oog op de X-ray flux.... Een echte X-5.7 flare! Mama,
mia! Dit ziende en beseffende kost 3 hartslagen....
Zou dan??? Weer veel overleg met collega Frank. De meeste indicatoren
schieten alle kanten op (meest loodrecht omhoog) behalve horizontaal. Deze
gebeurtenissen zouden wel eens alles te maken kunnen hebben met de grote
X-flare!
Nog weer niet veel later belt de collega, welke 1 verdieping lager de
nieuwste SOHO-beelden op het scherm heeft staan, dat er iets heel geks te
zien is.... Dat moet ik zelf maar komen bekijken. Ja: en dan pas begint
het werkelijk door te dringen... We zijn nagenoeg live getuige van een, zo
niet de grootste, uitbarsting van deze zonnevlekkencyclus! Een zo grote
uitbarsting dat zelfs de sensoren van de SOHO het niet kunnen verwerken.
Weer niet al teveel later blijkt ook dat de ACE satelliet eraan moet
geloven. Dat is spijtig want juist die satelliet kan ons zo mooi
waarschuwen als de grote schokgolf aan geladen deeltjes de aarde naderd.
Het mag natuurlijk niet zo wezen maar deze middag wordt aan van alles
besteed maar niet voor de baas.... Nu wil het geval dat wij een meetnet
exploiteren dat toevallig een bepaald soort straling staat te monitoren en
datzelfde meetnet heeft 11 jaar geleden al eens de invloed ondervonden van
een zonneuitbarsting. Zo kan ik een klein beetje aannemelijk maken dat de
tijd die ik nu aan de hobby besteed ook z'n "spin-off" heeft voor de baas.
11 jaar geleden kon niemand de raadselachtige gedragingen van ons meetnet
verklaren totdat ik, kennis hebbende van de 11-jarige cyclus en alle
effecten, eens op zoek ging en ja dat was toen bingo!
De eerste mails gaan het internet op en ik bel maar eens met de overbekende
buurman van ons aller KNMI. Het lukt mij niet mijn enthiousiasme te
onderdrukken en ik besef dat Jacob, als die eenmaal werkelijk door heeft
wat gaande is, minimaal 5 keer door het dak gaat!
Thuisgekomen is de allereerste aktie het aanzetten van de computer want we
kunnen in deze situatie natuurlijk geen seconde zonder internet. Ik kan mij
nu al absoluut niet meer indenken hoe we vroeger in dit soort situaties te werk
gingen zonder internet....
Amerikanen lopen weliswaar voor als het gaat om dit nieuwe medium maar ook
daar kost het blijkbaar toch wat tijd alvorens men in de gaten heeft dat er
iets "groots" gaande is. Maar als men zich dat eenmaal beseft dat gaat het
ook van "dik hout zaagt men planken". Die meldingen mail ik, in eerste
instantie, door naar onze eigen dms-mail mailinglist. De leden van deze
lijst zullen, zodra men die mail leest, zeker zorgen dat ze de komende
nacht paraat staan.
O.K. De eerste hektiek is er nu vanaf. Nu, bijna letterlijk: "down to earth". De kansen op poollicht komende zaterdag/zondagnacht lijken toch wel zeer groot zo niet nagenoeg zeker te zijn. Er staat een nagenoeg 100% volle maan. Vervelend maar niets aan te doen. Wie weet waar je het ding nog nuttig voor kunt gebruiken. Die bewolking: dat is andere koek. Gelukkig hebben wij de buurman en z'n KNMI. Inmiddels maximaal e-mail verkeer via de dms-mailinglist. Omdat ik mij nu voor het eerst de gelukkige (?) eigenaar mag noemen van een "vierwieler" kan ik gaan en staan waar ik wil. Dat vergroot de aktieradius tot veel verder als de gemeente De Bilt en directe omstreken.
Wat zijn de opties? Carl nodigt mij uit om naar VS-Lattrop te komen. Dan moet ik tijdig vertrekken en wil ik wel een klein beetje zekerheid dat het aldaar opgeklaard is als het donker is. Richting oosten - noord-oosten, Groningen, Drente, Overijssel, is een andere mogelijkheid omdat het weerkundig onderlegde deel van de bevolking beweerd dat we daar de meeste kansen maken. Ik besluit uiteindelijk te wachten totdat Jacob van het KNMI terug is. Die is daar om de laatste weerkaarten te analyseren en neemt deze mee naar huis.
Een blik op de diverse websites kost weer 3 hartslagen.... De voor aurora belangrijke Kp-index gaat door het plafond: 9! Dat betekent dat we in Nederland en Belgie nu werkelijk een zeer grote kans maken op het waarnemen van poollicht. Dit feit maak ik maar weer "wereldkundig" voor zover men dit al niet zelf heeft opgemerkt.
Jacob arriveert tegen 22:30 MEZT en laat de situatie zien. Ik weet inmiddels dat het oosten van Nederland niet meer realistisch is dus het wordt De Bilt en naaste omgeving. We moeten roeien met de riemen die we hebben: het wordt gaatjes (en daarin hopelijk poollicht...) kijken! Jacob en ik klampen ons vast aan enkele miniscule opklaringengebieden (of wat daar voor door moet gaan) welke in een NNW-stroming vanuit de kop van Noord-Holland op onze regio afkomen.
Carl belt op en ik geef de telefoon gelijk door aan Jacob. Jacob legt uit dat carl en Romke de meeste kans hebben als zij richting Munster gaan want daar is de wat bredere opklaringsband dan net aangekomen. Dat is de band die inmiddels net Gronau heeft verlaten. Inmiddels weten we van Carl en Romke hoezeer zij succes hebben gehad! Ik bel met Jeroen die in Arnhem staat de popelen om in aktie te komen. Ook tegen Jeroen hetzelfde advies: naar het zuid-oosten om de band met opklaringen te onderscheppen! Nog weer een telefoon later Max aan de lijn die vanuit Den Andel onderweg is naar Denemarken om daar z'n geluk te beproeven. Dat is eigenlijk het enige echt grote heldere gebied dat vanuit Nederland bereikbaar is vermits je maar tijdig bent vertrokken. En het is de vraag of dat voor Max wel het geval is... Inmiddels weten we na een telefoontje van Max uit Duitsland dat ook hij de Aurora tussen 01h30 en 03h MEZT onder een heldere hemel ten noorden van Bremen heeft kunnen waarnemen.
We maken onze laatste voorbereidingen en spreken tegen 23:30 MEZT af in de tuin van ondergetekende. Het wordt een dik kwartiertje later als we staande voor de flat onder de straatverlichting menen een wat groenachtige kleur aan de hemel waar te nemen. Het is twijfelachtig dus verhuizen we naar de achterkant waar we geen last meer hebben van de straatverlichting maar nog wel van de natriumverlichting in en rond Utrecht en De Bilt. Inmiddels trekt het zwerk geleidelijk aan weer dicht. In enkele kleiner dan miniscule gaatjes denk ik nog een donkerrode / paarse gloed waar te nemen, het is dan inmiddels ergens tussen 0 uur en 0h30m MEZT. We blijven hopen op de opklaringen maar het wolkendek lijkt zich toch steeds meer te sluiten alhoewel er soms wat dunnere delen in voorkomen. Soms krijgen we de indruk dat de hemel daarachter wel eens groengekleurd zou kunnen zijn. Het blijft bij "de hoop die de vader is van de gedachte", het zijn zeker geen bewijzen.
Concluderend.
Een wel zeer aardige "aktie" gehad die voor vrijwel allen helaas zonder aanschouwen
van poollicht is afgelopen. Inmiddels staan een aantal van de grafiekjes die hebben
geleid tot alle commotie op de welbekende internetsite van de Dutch Meteor Society:
http://www.dmsweb.org
Groeten,
(Dundee Satellite Receiving Station)
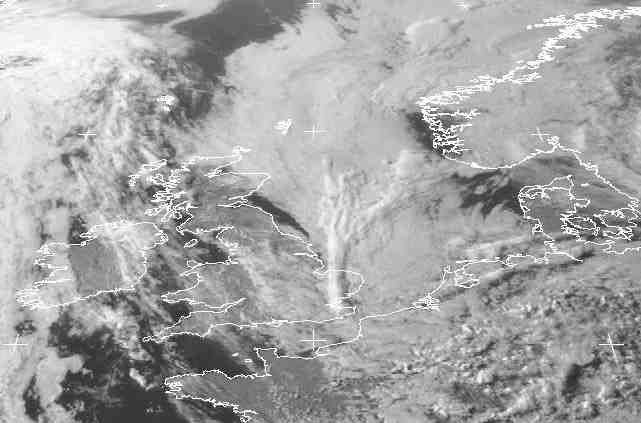
Dundee University, Scotland
(Dundee Satellite Receiving Station)
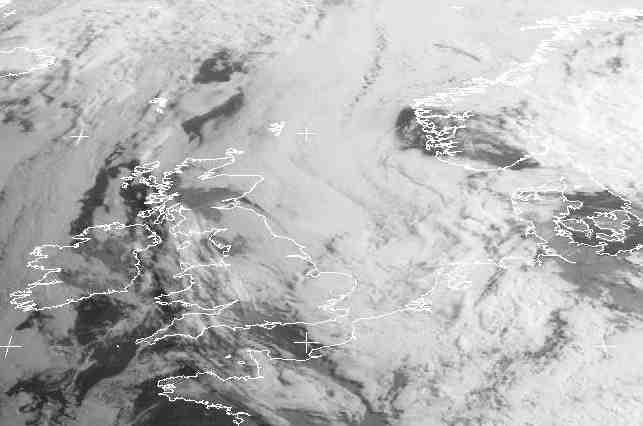
Dundee University, Scotland
(Dundee Satellite Receiving Station)
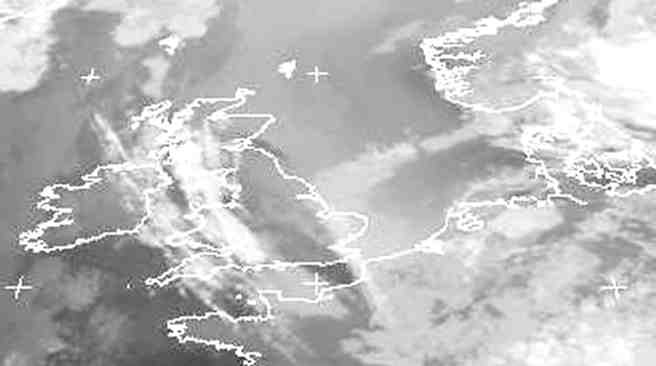
Dundee University, Scotland
On July 14, 2000, a powerful X6 class solar flare from active region 9077 triggered an ongoing proton storm in the vicinity of Earth. The explosion also produced an Earth-directed coronal mass ejection.
The radiation storm appears to be a S3-class event which, according to NOAA space weather prediction scales, can cause the following effects on satellites: single-event upsets, noise in imaging systems, permanent damage to exposed components/detectors, and decrease of solar panel currents.
It appears the CME of July 11 has arrived at approximately 1500UT July 14. Minor and possibly major storm conditions could occur on July 14 and early July 15.
A major X5.7 flare from region 9077 (N22W07) occurred at 10UT July 14. It appears a full halo CME accompanied this large flare. More details as they become available.
CANOPUS Real Time Auroral Oval, Update interval ~00:05
SEC Space Weather Advisory
Official Space Weather Advisory issued by NOAA Space Environment Center Boulder, Colorado, USA
RADIATION STORM OCCURS , MAGNETIC STORM PREDICTED
2000 July 14 at 10:14 a.m. MDT (2000 July 14 1614 UT)
**** RADIATION STORM OCCURS , MAGNETIC STORM PREDICTED ****
A large, complex sunspot group has produced one of the largest solar flares and associated radiation storms seen in recent years. The flare peaked at 4:24 a.m. MDT (1024 UTC) on July 14 and resulted in a radio blackout that reached R3 (strong) levels and a solar radiation storm that reached S3 (strong) levels. The solar radiation storm, which continues at the time of this advisory, is the largest observed since October, 1989.
Images from NASA's SOHO/LASCO spacecraft showed that a large, fast-moving coronal mass ejection (CME) followed the flare and is headed Earthward. NOAA space weather forecasters predict that the CME will impact the Earth's magnetic field on Saturday afternoon and will cause a geomagnetic storm that is expected to reach category G3 (strong) to G4 (severe) levels.
The radiation and geomagnetic storms are expected to produce adverse effects on spacecraft operations, power systems, high-frequency radio communications, and low-frequency navigation signals. In addition, the geomagnetic storm is expected to produce aurora displays that will be visible over much of the U.S.
The sunspot group responsible for this event will be visible from Earth until it crosses the Sun's west limb on July 21 and more space weather storms are possible until that time.
Data used to provide space weather services are contributed by NOAA, USAF, NASA, NSF, USGS, the International Space Environment Services and other observatories, universities, and institutions.
A powerful solar flare on July 14, 2000, has triggered an ongoing radiation storm around our planet. The eruption also sent a fast-moving coronal mass ejection toward Earth. Aurora sightings may be possible this weekend.
July 14, 2000 -- This morning NOAA satellites and the orbiting Solar and Heliospheric Observatory (SOHO) recorded one of the most powerful solar flares of the current solar cycle. Space weather forecasters had been predicting for days that an intense flare might erupt from the large sunspot group 9077, and today one did.
"Energetic protons from the flare arrived at Earth about 15 minutes after the eruption," says Gary Heckman, a space weather forecaster at the NOAA Space Environment Center. "This triggered a category S3 radiation storm."
According to NOAA space weather prediction scales, an S3 storm can cause the following effects on satellites: single-event upsets, noise in imaging systems, permanent damage to exposed components/detectors, and decrease of solar panel currents. It can also expose air travelers at high latitudes to low levels of radiation, the equivalent of a brief chest x-ray.
"Given the information I have now, if I was advising my own daughter I would tell her it's safe to fly," says Dr. Wallace Friedberg of the Federal Aviation Administration's Civil Aeromedical Institute in Oklahoma City. " In fact if she were going to come visit me today (she lives in Florida and I'm in Oklahoma), I would tell her to take a plane rather than drive because even during this solar radiation event flying would be safer."
"The energetic particles from this flare arrived very quickly," continued Heckman. "Protons have been observed in the past to arrive between 15 minutes and several hours after a flare. This event was definitely one of the fastest, but we don't yet have all the numbers to say exactly how it ranks in this category. "Soon after the solar flare, which occurred at 1024 UT (6:24 a.m. EDT), coronagraphs on board the ESA/NASA Solar and Heliospheric Observatory recorded a "full-halo" coronal mass ejection (CME). CMEs are gigantic bubbles of electrified gas carrying away as much as 10 billion tons of solar material. This one appears to be heading toward our planet at 1300 to 1800 km/s.
There's no cause for alarm. When a CME hits the magnetosphere -- the region around Earth controlled by our planet's magnetic field -- most of the incoming material is deflected away. If the shock wave is very strong, as this one might be, it can compress the magnetosphere and unleash a geomagnetic storm. In extreme cases, such storms can induce electric currents in the Earth that interfere with electric power transmission equipment. Satellite failures are possible, too. Geomagnetic storms can also trigger beautiful aurorae. These "Northern Lights" are usually seen at high latitudes, but they have been spotted farther south than Florida during intense disturbances. The last time this happened was April 6, 2000. "At this time, I'm making plans to look for the aurora Saturday night," says Heckman, who lives in Colorado.
Whether or not an auroral display is triggered by the blast depends on the orientation of the magnetic field within the CME's approaching shock wave. Magnetic fields with a southward directed component can create a weak point in Earth's magnetic defenses and make auroras more likely.
"Solar flares and CMEs occur whenever there's a rapid, large-scale change in the Sun's magnetic field," explains David Hathaway, a solar physicist at the NASA Marshall Space Flight Center. "The solar active region that produced the eruptions [on July 14] had a complicated magnetic configuration. Oppositely-directed magnetic fields were seen right next to each other."
Active region 9077 is very near the center of the Sun's visible disk. Solar rotation will carry the sunspot group toward the Sun's western limb by late next week. For the next few days, however, any additional eruptions are likely to be Earth-directed. The fireworks may not be over yet!
SOLAR ACTIVITY FORECAST:
SOLAR ACTIVITY IS EXPECTED TO CONTINUE AT MODERATE TO HIGH LEVELS. REGION 9077 AND 9085 AND 9081 (N02E29) HAVE POTENTIAL TO PRODUCE M-CLASS EVENTS. ANOTHER MAJOR EVENT IS POSSIBLE FROM REGION 9077.
GEOPHYSICAL ACTIVITY FORECAST:
DUE TO THE EXPECTED ARRIVAL OF AN EARTH-DIRECTED FULL HALO CME FROM THE X5/3B EVENT MENTIONED ABOVE IN 1A. THE GEOMAGNETIC FIELD IS EXPECTED TO SEE AN INCREASE DURING THE LATTER HALF OF THE FIRST DAY. MAJOR TO SEVERE STORM LEVELS ARE POSSIBLE AFTER THE STORM ONSET THROUGH THE SECOND DAY OF THE PERIOD. BY LATE ON THE THIRD DAY OF THE PERIOD ACTIVITY SHOULD START TO DECREASE TO ACTIVE TO MINOR STORM CONDITIONS.
Geomagnetic Storms:
Probabilities for significant disturbances in Earth's magnetic field are given for three activity levels: active, minor storm, severe storm
Updated at 2000 Jul 14 2200 UT
Mid-latitudes:
            24 hr     48 hr
ACTIVE      10 %      10 %
MINOR       25 %      20 %
SEVERE      60 %      70 %
High-latitudes:
            24 hr     48 hr
ACTIVE      10 %      10 %
MINOR       15 %      10 %
SEVERE      70 %      80 %
* Major Significant X5 Proton Flare Alert *
* Category S3 Solar Radiation Storm Alert *
* Middle Latitude Auroral Activity Warning *
* Low Latitude Auroral Activity Watch *
At 10:24 UTC on 14 July, the largest solar flare to be directly observed so far this solar cycle was spawned by active sunspot Region 9077, which has now exploded with a total of three major X-class flares. Todays flare was the largest of all and the most serious, reaching an X5 category in x-rays and accelerating very high energy protons toward the Earth.
This solar radiation storm is currently categorized as an S3 event and is approaching a category S4 event (S1 being weak and S5 being extreme). People on Earth are safe from the effects of these adverse space environment conditions. Satellites and people in orbit are at highest risk. Here are some of the possible effects of an S3/S4 radiation storm:
Ionospheric radio signal propagation has been completely blacked out for all communications paths that traverse through the high latitude and polar latitude ionospheres. No high frequency (2 to 30 MHz) radio communications through the high and polar ionospheres are expected until later on 16 or 17 July.
There have already been numerous confirmed anomalies on spacecraft. The SOHO spacecraft is experiencing significant noise on its imaging systems, which is rendering scientists abilities to monitor solar activity more difficult. The ACE spacecraft has suffered suspected contamination in its ability to accurately measure the speed and density of the solar wind. And the POLAR spacecraft (which images auroral activity and other important space environment properties) is unable to produce images of auroral activity due to suspected contamination of its imaging systems (these are just a few examples).
Today's major X5 solar flare was associated with a full halo coronal mass ejection that is expected to make a near head-on collision with the Earth. The velocity of the disturbance is not known precisely because of the level of proton-induced image degradation in the SOHO cameras. Radio observations of the flare revealed a strong inner-coronal shock wave that had an estimated velocity of 1,300 kilometers per second. However, SOHO team members determined a possible disturbance velocity (in the outer corona) as high as perhaps 1,775 kilometers per second.
Predictions on the time of arrival of this disturbance will vary depending on the type of data that is used. However, it appears that the disturbance may arrive between approximately 19:00 UTC on 15 July (3 pm EDT on 15 July) and 16:00 UTC on 16 July (noon EDT on 16 July). The arrival of this disturbance is virtually certain to occur.
A middle latitude auroral activity warning has been issued together with a low latitude auroral activity watch for all middle and low latitude regions of the Earth. This disturbance has the potential to produce intense displays of auroral activity over these regions. Observers interested in watching for these events on their home computers are encouraged to obtain a copy of the free STD Aurora Monitor software package, which will provide near-realtime updated information and imagery that you can use to monitor conditions as they happen. The software is available at: http://www.spacew.com/aurora. It is a relatively small download of only 2.5 megabytes but is an immensely useful package for monitoring auroral activity. Sky & Telescope has graciously agreed to serve as an additional mirror for this software. We apologize for not having versions available for Macintosh or Linux systems. Other users may visit: http://www.spacew.com/www/aurora.html.
WE WOULD APPRECIATE IT IF PEOPLE WOULD SUBMIT SIGHTINGS OF AURORAL
ACTIVITY TO THE AURORAL ACTIVITY OBSERVATIONS NETWORK AT:
http://www.spacew.com/www/subaurora.html
Or use the aforementioned software to submit your sightings to the Network.
Space Weather News for July 15, 2000
A powerful shock wave from the fast-moving July 14th coronal mass ejection has arrived in the neighborhood of Earth. An extreme geomagnetic storm was underway at 1900 UT (3:00 p.m. EDT) on July 15th. If conditions persist as they are now, aurora could be visible at middle (and possibly even equatorial) latitudes. The best time to view aurora is usually near local midnight. In this case, sky watchers are advised to look for aurora as soon as night falls. For more information and updates please visit http://www.spaceweather.com
Readers are invited to send pictures of tonight's aurora and the July 16, 2000, total lunar eclipse (visible across the Pacific Ocean) as an email attachment to phillips@spacescience.com for possible posting on spaceweather.com and/or spacescience.com.
Today in Space -- 16 Jul 2000
GEOSTORM SUBSIDING
A powerful interplanetary shock wave struck our planet's magnetosphere on Saturday and triggered a severe G5 category geomagnetic storm. The storm now appears to be subsiding. During the event, which began around 0400 UT on July 15th and persisted for 24 hours, the solar wind velocity reached nearly 1000 km/s. Bright aurora were spotted as far south as 40 degrees latitude in Europe and the United States.
The Planetary Kp Index, a measure of geomagnetic unrest, has soared to a value of 9 yesterday, indicating that an extreme storm was in progress. Data courtesy: NOAA/SEC.
According to NOAA space weather prediction scales, G5 storms can cause the following effects: aurora seen as low as the equator, HF (high frequency) radio propagation impossible in many areas for one to two days, satellite navigation degraded for days, low-frequency radio navigation out for hours.
- http://spaceweather.com/
- http://www.sec.noaa.gov/rt_plots/kp_3d.cgi
- http://www.sec.noaa.gov/ace/
- http://sec.noaa.gov/SWN/
- http://www.spacew.com/www/aurora.html
- http://members.mint.net/n1bug/prop/aumon/aufr.html